
Updated 5/18/2021 0630 EST
Update log:
| Date | Revision |
| 3/22/2021 1230 EST | Added table for tracking short position that “Stack Shiny” posted on twitter. Seems someone is tracking short positions trying to get reduced already! |
| 3/23/2021 0630 EST | Added COMEX daily delivery to show amount drained and added John Adams pics regarding Perth mint evidence. Added Zero Hedge article |
| 3/24/2021 0630 | Added Perth Mint evidence under Industrial Phase. Added to fundamentals by adding link to Happy Hawaiian DD piece on Reddit. Added more accurate number on debt load and graph. Added GATA cannot get leasing info activities from BoE. Added cliff drop pics from 3/23 where no fundamentals changed to create such a significant drop in price. |
| 3/24/2021 1230 | Added reports of ALLOCATED metals from ABC Bullion in Australia defaulting. Added a metric for ALLOCATED defaults and put to yellow, as this was the first report. |
| 3/27/2021 | Added latest COT report and “rehypothecation issues” to the dashboard and Industrial section. Updated COMEX deliveries to show 57.9m delivered this month, with 25.7m removed from COMEX. Mention 3/27 as massive spike down which could have cleared a way for swap dealers to buy back to now be net long. Update on Perth Mint via John Adams having 14 tonnes of unallocated removed?? |
| 3/28/2021 | Added new metrics chart to add columns on defining measures. Added Rick Rule comment on Canadian supply. Added metric ” Short interest being reduced by swap dealers” . Added charts that show swap dealers could be now behind the bus rather than in front of it. |
| 3/29/2021 | Added Bullion Now to unallocated “bank run”. Updated metrics table. Updated WSS screenshot of tracking all items. Added John Adams tweet on many more running to cash in. |
| 4/1/2021 | Added item for real rates under fundamentals. Changed media attention in Industrial phase to mockery based on Perth Mint coverage. |
| 4/4/2021 | Added picture of 30 year from ZH. Updated DXY to 93. Added several more bullion dealers out of metals. Changed fundamentals on metrics to orange+ due to real rates about to move significantly lower. Moved complaints of “unallocated” accounts to RED in phase 3. Added notes of complaints of unallocated. Updated COMEX daily table to show 26m oz taken off in March. Added notes to silver supply deficit and how a demand surge could hopelessly overwhelm supply reinforcements from the sidelines due to refinery capacities. |
| 4/7/2021 | Added John Adams evidence of Kitco unallocated providing up to 1 year delays on their silver allocated. Added context to qualify single source for John Adams. |
| 4/16/2021 | Changed price over $25. Added Bob Coleman to wholesaler premiums. Added Red to Fundamentals as we are now seeing -1% real rates. Changed industrial to OR+ on mint news and Coleman seeing premiums which now support multiple sources of higher premiums. Changed to red on mint closures and stupid high premiums with libertads now out of production and most mints now out of products. Multiple stoppages with mints like with libertads. Coleman also reports potential CFTF issues with 28+ day delays in order to ship. Many complaints now of unallocated “issues” across more than several companies. Supply chains severely disrupted – mines also withholding supply. Price trending now towards $30, with John Lee suggesting $27.50 could be hit within a few trading days. Ted Butler reports BoA short 300m physical oz on lease from JPM. No green on the entire board. |
| 5/7/2021 | After slacking on this for weeks, prices have moved up over $27. Updated chart here. John Adams in legal disputes with Kitco at the moment – doesn’t change the reporting of events, just wanted to note that Kitco is disputing his claims for sake of fairness. |
| 5/18/2021 | DXY falls below 90, real rates at -2.5%. Media attention now highly focused on inflation everywhere – as well as now massive supply chain issues. This is resulting in manufacturers buying massive amounts of supplies to hoard and stock so they do not run out down the road. |
| 7/28/2021 | Updated the chart with note under it for today’s date |
Current Status: RED- ALERT (upgraded)
5/18 – no one can now deny inflation, and those that do are sort of mocked. It is VERY true that year over year numbers may introduce a “transitory” effect as items become normalized from the previous year. HOWEVER, no one really believes the CPI that much and even if you do, you cannot deny that the amount of liquidity in the system is now causing people to not only buy up what is there, but also buy up future supplies to prevent them from running out. There are massive labor shortages due to high unemployment benefits and this may have the intended effect of raising wages for workers, but the unintended consequence of hiring a guy to scoop ice cream at $15 per hour is the $12 ice cream cone on the other end of this. Meanwhile, the inflation rate will have the markets tugging interest rates up, which could have the ability to crack the tech and crypto bubbles – and a flight to safety is normally in bonds – but gold may catch this due to the bonds being severe into negative territory.
3/24 – Request – if ANY of you start picking up on silver stories in mainstream media, please email them to me at NathanFisher47@gmail.com. Right now, I’m interested to see where the Perth mint unallocated story goes, as this could reveal other unallocated systems cracking. Compiling all of these stories could move the metrics dashboard indicators. IF people wanted their silver and cannot get it, and get paid out in cash, instead – I wonder what would happen if this cash then went to buying allocated, physical, or PSLV?
(Please check out the gang at WallStreetSilver here)
Check back here every few days, bookmark it. I plan to try and keep this updated once every day or two. Check the update date and below I will mark changes, when they are made in the log which will be added at the bottom. I might do an update once a week or so if I don’t have a ton to add.
Preface
It’s one thing to claim you are doing well. But how can you measure this?
Luckily, in my “real job” I do this as part of my career and have for 25 years. These are called metrics, and they are used in a wide array of measurements. How much did I do (quantity)? How well did I do it (quality)? I’m not going to get into the weeds here too much, but this can go nuts with things like statistical process control, regression analysis, etc. One element of my job the past 25 or so years is to evaluate customer complaints, or log customer compliments. I actually did nothing but this for roughly four years (1998-2002) for Electronic Data Systems (EDS) at the Vanguard Group of Mutual Funds in King of Prussia, PA – just outside of Philly. Vanguard managed over $500B in assets at the time, and EDS had a contract of 90 technicians servicing 17,000 desks. I was responsible for tracking all of our numbers with desktop, phone, and server-side support to ensure our work met service level agreements with our contract. When I would detect trends or defects, I made recommendations to the managers to make adjustments. At Villanova when I went to grad school there, it was called “Decision Sciences”. So, lots of cool stuff I learned to make decisions on. Take lots of data points and turn that into information to then make critical decisions based on that information – create benchmarks, then observe the changes that your recommendations made.
This line of work helped me study ecosystems, understand the levers and dials, and then detect when there were deviations, trends, or failures in the system. Luckily, I found a ton in the silver ecosystem.
So – the big picture is…HOW can we measure the progress of the silversqueeze?
As I was pondering this yesterday for a piece, I saw this come up on my twitter feed….

I got permission from GT to post this. But this is what all of you need to be asking every day. Challenge your investment thesis, daily. Are you missing something? The evidence you see – challenge it to get primary sources. Don’t rely on grandmom’s neighbor telling her roofer something that was overheard by your cousin. I felt I was seeing a VAST picture when I posted my article the other day – but I didn’t lay out the metrics side of it I was seeing. That piece was a narrative to tell you where I felt this was going. This is more of a data and information analysis of everything I’m seeing.
I think his tweet had an EXTREMELY fair point. While this was all rattling around in my head, I saw this and felt I must somehow take the euphoria I have in my head and put this into metrics, of sorts, so we can gauge progress. One issue that is brought up by GT is “quality of data”. In order to get good information to act on (decision sciences), you need to be able to have good input into the system. Some of the data presented wasn’t wholly accurate, and many keep bouncing off the same information. I did ask a question two months or so ago, “are we in a silver echo chamber” where I wanted to see if I was missing something as part of my investment thesis.
First – I will draw a summary dashboard to show progress. Next, below that, I will define each and go further into the analysis of each piece.
My theory is, this is all broken into 4 major phases driven by fundamentals. If we can realistically gauge the progress of each phase, we can then demonstrate where we are – and what may need to happen next in order to trigger the silversqueeze, or perhaps push price towards that $50 mark.
Dashboard (5/18)
Summary dashboard. Things in RED are GOOD for silversqueeze and HIGH. Orange is on its way to red, but has a few steps. Yellow is elevated. Green is “situation normal”, for now. I have a few items in red font (sorry to the color blind out there) to show some things might be trending a certain way. For example – in the DXY index at the top, I mention it is trending towards below 90.

Edit 7/28 – Updated the metrics chart to show that the pressure on retail has subsided and 1,000 oz bar premiums have come down, but underlying mechanics seem to be rumbling at the fundamental issue. Retail is just a canary in the coal mine at times due to the small amount of total market it is. Underneath, you now see real rates at -4% depending on what debt instrument you are calculating from. To add to this, you now see over the last 6 weeks commercial shorts have reduced Open Interest – by a LOT. All OI has been reduced by over 125m oz. This seems to be a pre-condition prior to letting the price run up, as the shorts see losing control and get out of the way of the Mack truck coming. I feel this is Yellowstone about to erupt and the price move twice to $30 was the rumbling, and the next move up it bursts up over $30. End edit
When I did my video (19k views??? Wow!!) I discussed these phases. It was early February, and I was definitely seeing how this could play out. For now, the one thing that has delayed everything overall has been the 10yr. That being said, it is included that into my “fundamentals” section with real rates. At .91 that would have been red.
Fundamentals
Current Status: RED
Overall Story – (3/24) check out a deep dive on WHY you should invest in silver here, written by the Happy Hawaiian. This post has a great backer to it…

Real rates (5/18) – These remain about neutral with both 10yr and CPI tracking about 1.7 each. Since December, 10yr has climbed from .91 to 1.75. CPI was 1.6 and now 1.7. Inflation expected, and expectations are Yield Curve Control coming. Real rates at -.63 at the moment. I wrote about how the relationship between real rates and gold is the grand daddy relationship, and by proxy, silver’s relationship to gold reveals a strong correlation from real rates to silver. 5/18 – real rates now at -2.5%. When gold and silver made massive moves last summer, it was at -1%.
Update 4/18 – we saw real rates now hit about -1%, and this appears to be trending lower. Seems US will be selling a ton of treasuries the next 3 weeks.
Update 4/4 – ZeroHedge posted a 30year treasury chart with pretty lines. To the naked eye, it appears that the 30 year is about to go down. This will take the 10 year as well. CPI measurements to come out April 13th and hard to imagine this number going down. This essentially states that measurable downward movement in real rates inside of 2 weeks is coming. India also just bought ridiculous amounts of gold in March.

DXY index (5/18/2021) – fell below 90, and down from a year ago where it peaked at 102. Expected to drop further into the 80s.
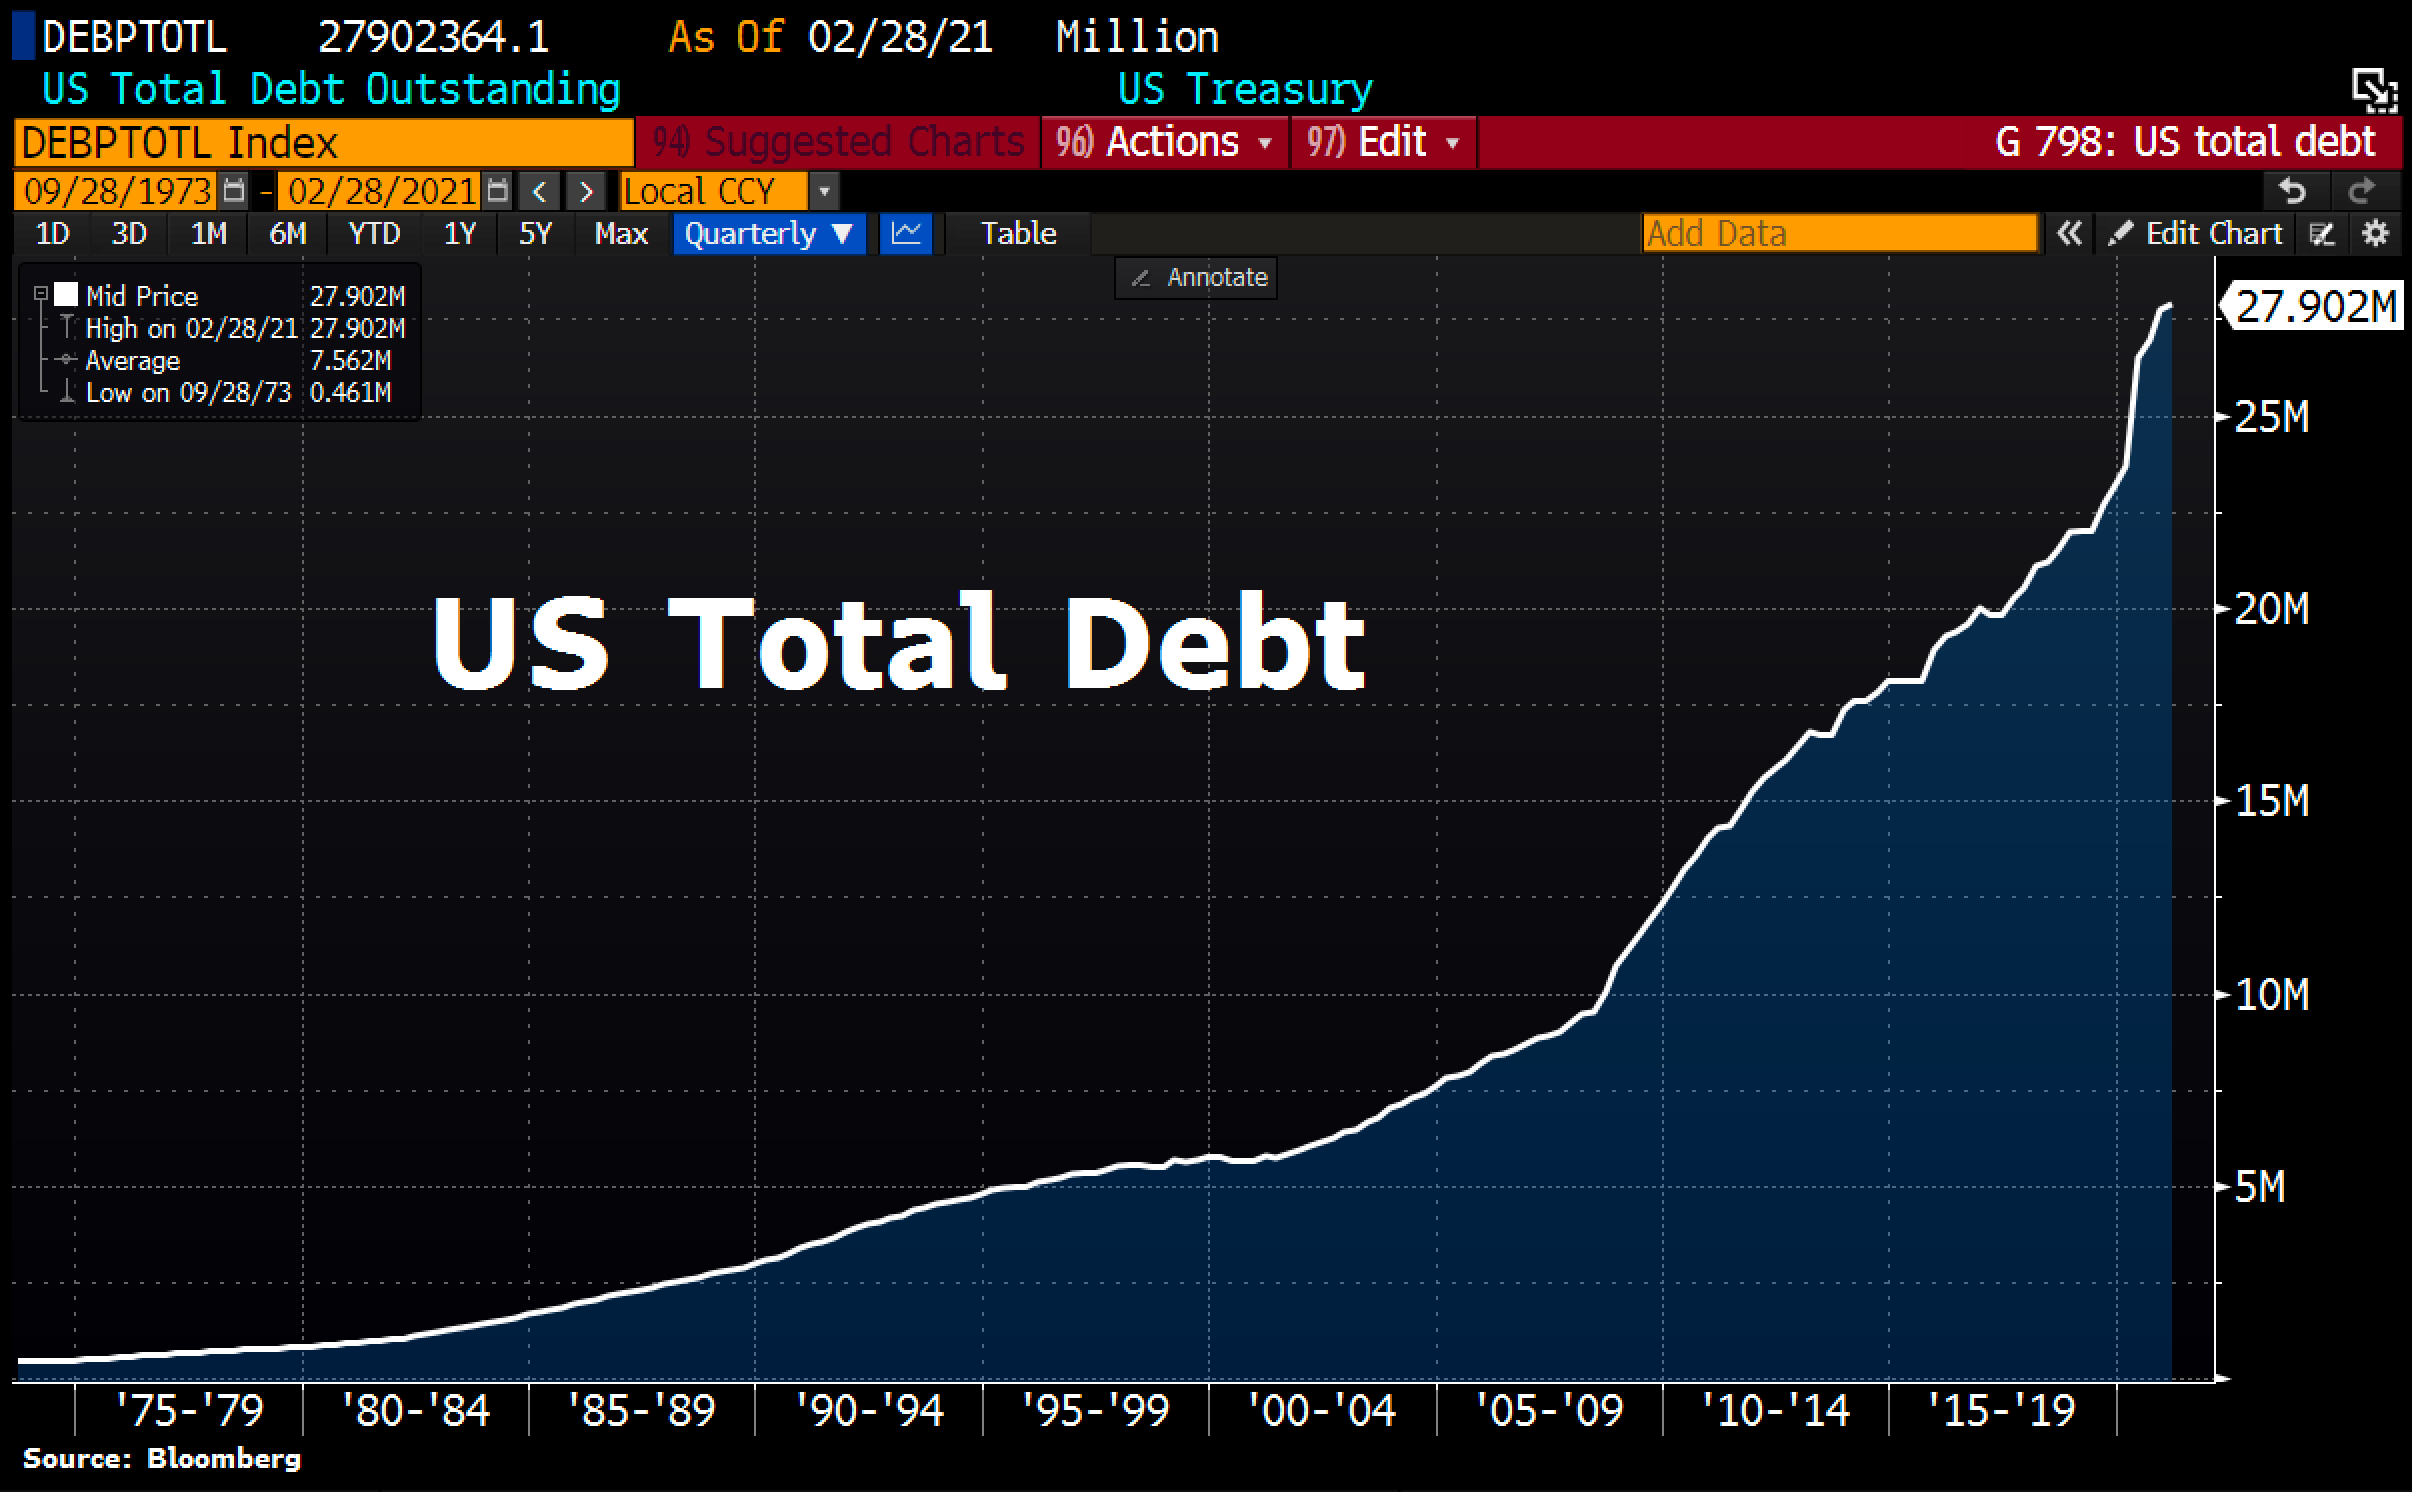
Debt load (3/24) – hovering around $27.9T, but Fed has been taking on water and somewhere around 7T. Expected to grow fed balance sheet with continued MMT and stimulus, despite people talking about a “heated” economy. No one paying off debt anytime soon.
Money printer goes brrrr (3/22) – with $1.9T stimulus just dispersed, next is discussion of a $3T infrastructure bill. More and more programs mentioned to get “free” stuff. At the same time, Chinese appear to be buying commodities with USD to then flood the US with more dollars. Russia has more gold than dollars. Possible move from USD as world’s reserve currency seems inevitable. Less foreigners buying US debt.
Price moving up (5/18) – Now well over $28. Since I got involved in Nov 2019, price is up about 50% or so at times. However, price has hit $30 twice in the past year and is in the $25 range as I’m writing, being knocked down $.80 this morning, on no news. This can signal:
- Shorts knocking people off of paper, then about to cover a LOT
- Shorts firing out paper to knock down spot price in order to buy at a discount on spot market. They use the paper market to move the physical price to where they want it, then buy on spot. 5m more oz need to be covered this month on COMEX, and it’s possible some who owe yet are naked short and need to move the price to buy significant metals cheaper than they sold it for.
- Could be end of month or end of quarter profit taking, which seems to have V bottoms.
Silver supply deficit (5/18) according to most charts I’ve seen with the silver institute, it appears there was a 350m oz deficit last year and if investment demand through the first 3 months is any indicator, the deficit this year will be biblical. (update 4/4) – I wrote recently about how silver may have massive supply stores on the sideline, but violent price moves up WILL attract FOMO investors and backups at refineries would only allow a trickle of recycling supply to come in to the market as mining supplies could only perhaps dial up 10-20% inside a year, at most. Meaning, even with massive stores of jewelry and silverware on the sidelines, they may not be activated until price is at $50-$75, and then even so – there’s a finite capacity of refineries to take sterling or junk silver to .999 fine bars. Since silver is an asset that is valued more the higher the price, demand could overwhelm the rate of any supply reinforcements easily. This could lead to the parabolic rise I discuss from $50 to perhaps $125. Once refineries get a 2-3 month supply, this could then lower to $75 or $50 as the new floor. 5/18 new article says manufacturers are buying EVERYTHING not nailed down to secure future production Inflation Rate 2021 and Shortages: Companies Panic Buying as Supplies Run Short – Bloomberg
What needs to change with fundamentals? What triggers can improve the status?
- (5/7) Real rates to drop even lower. CPI numbers coming out next week could really make gold heat up. Could be more bond buying or YCC, with CPI creeping up. (4/4)Look for falling 30yr soon to take 10yr down, as CPI numbers should be gently creeping up to reflect high commodities prices.
- DXY may go down over time, which is good for metals. This means more fiat fed notes needed to buy one ounce of your favorite shiny
- More programs giving out money is terrible for the country, great for metals in that it dilutes the currency
- Continued reports of investment demand and deficits
- Price needs to get up above $30, hard to do so with 10yr in the way, but silver appears to keep absorbing hits.
Phase 1 – Retail
Current Status: RED ALERT
With retail, it’s a SMALL portion of the overall silver market. There’s only a relative small amount for sale in the windows of stores, so to speak.
National Retail Delays (3/22) – still seen with major bullion dealers. My LCS is still very limited on supply of most items.

National Retail Shortages (3/22) – I’m tracking shortages with high premiums on American Silver Eagles and other products. It appears there has been a relentless 7 weeks straight of pillaging dealers. I know many want to vilify dealers for this. Look, they are in business to make money, not to make you happy. If you take all of the product they have at low premiums, and they have to wait 4 weeks for more product to come in, that’s 4 weeks of zero sales they are making which can put them out of business. By having high premiums, this in theory slows the rate of purchase for them to reload, but also helps them bank money for when their shelves are bare. When premiums low, buy physical. If premiums are too high for you and you want to affect the silversqueeze movement, you can buy PSLV and/or OneGold to have them buy 1,000 oz bars. OneGold may help you play a rapid move in silver without losing a ton on premiums and gives you optionality of taking metals from Apmex if you decide, down the road, to buy metals. Maybe you buy at $25 today with OneGold, capture the move to $35, when wait for premiums to come back down a lot, then buy retail with that at Apmex. I buy any physical to hold wealth and perhaps pass down – and act as insurance against Weimar hyperinflation. I’m not buying silver at $31 ($25 plus $6 premiums) to sell when silver hits $35.
5/8 – Apmex is selling silver eagles $15 over spot. You tell me what it is coming next.
Media attention levels (3/22) – while there was initial media attention on the “failed silversqueeze” movement, they were 98% wrong. A fraction of the silversqueeze thought it would be cool to play the futures, and were squashed like bugs on a windshield. The rest of us have been focusing on buying physical metals, which is where the real squeeze is. I feel there have been some media stories with mint shortages, retail delays, etc. ZeroHedge has had some of our people have stories on it. It’s important first and foremost for our community to understanding and digest the real news, and then spread that out. I feel external entities are starting to pick up on it when I’m hearing about supply chain shortages in the greater sense.
What needs to change with retail? What triggers can improve the status?
I think the silversqueeze billboard campaigns, memes, videos, DDs on WallStreetSilver, and constant and relentless buying pressure will help put more pressure on the market. The billboards, memes, and videos can serve to respects to “increasing the base” of people buying. Part of metrics (in my business) is to sell your story in order to increase your sales, extend existing lines of business, and to broaden your base of business. Buying out Apmex and SD Bullion in a weekend is cute. But we must be relentless and continue to recruit more by understanding our book and selling it to others.
The big picture is – we just want a fairly traded silver market, and we are fearing inflation. By buying physical silver, we are protecting our finances and our families from potential devaluation of currency – as seen throughout history. A BYPRODUCT of this is that it may see the artificial price suppression games be removed from the market by forcing the paper game to have less effect on the physical price of silver. We have all seen how the paper trades can trade 2.5x yearly mine supply in a single day!
5/18 – Media attention now hyper focused on inflation and supply shortages. Matter of moments before silver mentioned over and over. Gold will be mentioned as inflation hedge on every TV station in the country inside of 4-8 weeks and that takes silver with it.
Phase 2 – ETFs
Current Status: RED ALERT
PSLV adding metals (5/7) – I put this as a metric because we all trust that PSLV as a close-ended fund is adding physical metals. The past month, they have added about 30m oz. We all also know that Eric Sprott has literally billions of ounces of silver in the ground and is a partial owner now of about 150 mines, including about to be a 16.6% owner in First Majestic. This tells me PSLV IS adding silver because it benefits Sprott to have a much higher silver price. He also was a fan of Neumeyer holding back silver to get higher prices on it. Another 4d chess musing – what if, for argument’s sake, one day Sprott miners all just stopped selling for a month? Not today, but someday down the road you might imagine these miners all getting together and setting up their own exchange. Why would they sell their product based on the paper price some bankers are telling them, when clearly every other commodity on the planet is way higher. It seems as if when other commodities have supply issues, price goes up. With silver, we see premiums go up but price not move. I feel price will move, soon. Update 5/7 – now added OVER 70m oz since silver squeeze
ETFs sourcing issues (5/7) – In early February, SLV and SIVR changed their prospectus to say “all metals might not be here”. Ronan Manly reported 85% of LBMA used up on ETFs. Unclear where that is now, but these seemed to be issues with sourcing. PSLV has had issues with “tightness” in getting 1,000 oz bars from North America. Update 5/7 – by just about every metric possible, 1,000 oz bars are higher in premium, by a lot.
Reports of 1,000 oz bar tightness (3/22) – this has been reported first by Andrew Maguire for months, but more recently you had Chris Marcus, Rick Rule, Andy Schectman and others reporting all kinds of problems getting these bars.
Investment Demand (3/22) – You could see on the SRSRocco report slides that investment demand OVERTOOK industrial demand in 2020, with over 500m oz of investment in 2020 and it seems like it is not stopping. With silversqueeze, PSLV challenge, and other items – it seems investment demand is robust and will continue. Eagles sales YoY were impressive.
Media attention levels (5/7) – Ronan’s piece and some others are getting attention on places like ZeroHedge. 5/7- seeing LOTS of disinformation on CNBC and Kitco. They are running out the usual muppets to quash general investors.
What needs to change with ETFs? What triggers can improve the status?
I think we are pretty good in this avenue, but I feel media attention is what is needed to take this to orange. Hoping some of these billboards get people asking questions. Perhaps we get local news outlets in these cities asking what this is about, and broadcast to their local city’s news programs for more eyeballs. Wall Street Journal should be picking up that the big driver in silver prices – a steady 60% in industrial demand, was massively overtaken by investment demand, and how that could pivot the price of the commodity far higher. CNBC muppets might actually have a contrarian on to discuss this and give the silver investors a voice.
Phase 3 – industrial
Current Status: ORANGE+ ALERT
With industrial – this is the Godzilla I write about. If Toyota, Tesla, Apple or other producers of thousands of products that use silver realize they may be running into a shortage, they will all pick up the phone and order more. If an iPhone uses $.04 of silver, it doesn’t matter if the price of silver goes up 3x. That iPhone that used to cost $1,000.04 will now cost $1,000.12. However, if they do NOT have this supply, they cannot make the product.
5/18 – short positions are growing a LOT, and it appears price keeps rising. This is telling me there is serious buying happening as we speak. Shorts may have their way a few times along the way, but this is really a bad time to be selling.
4/18 update – it seems that wholesaler premiums are rising. Unallocated may be getting converted to allocated or taking what physical is there, out of the system. Less people are investing in “synthetic” silver, which is then removing this derivative from the system and instead putting more pressure on direct physical inventory.
(3/29) Mint shortages, mint closures, sites stop taking orders, cancellation of retail orders, complaints of defaults with unallocated accounts, and global retail issues – I’m lumping these all in to one status here and citing the WallStreetSilver post which is tracking this here. I updated the picture below, and there’s a lot more there. OP has said he will stop tracking, but this is a great resource to look at from 50,000 ft view to see the issues.

Big picture is there’s news reports of shortages, anecdotal reports of unallocated defaults, mints closing to “retool” or “relocate”.
Take a look at what this looks like….I asked them to see if they can continue to update this. My article from a few days ago is linked in there as well. One BIG thing that is circumstantial evidence is reports of the Perth Mint defaulting in paying out silver to unallocated account within 10 days, and instead putting them on wait lists to possibly wait up to a year. Idea here is it’s very possible rich people are pulling from their allocated or unallocated and drained, industrial has drained, or other exchanges were buying up unallocated in order to meet contract demand. It’s impossible for someone like me to measure the vaults and unallocated in the world – but this MIGHT be measured by tracking complaints of defaults to get that circumstantial evidence.
Complaints of defaults from UNALLOCATED accounts (3/27)
4/7 addendum – What needs to be stated below is that all of these accounts are coming from one person, who is not a member of the media. Usually members of the media may have source validation by an editor of sorts, to verify the claims. In this case, we have a single source of claims that are not independently verified. My INTENT to share this is to possibly get media attention. In this case, John could work with members of the established media – which can then potentially have source validation. The media may not be as big as ABC or Sky News in Australia, but could be a YouTube up and coming channel where their reporters are then able to independently verify these emails and sources – and begin to build a story. What is interesting about the story, to me, is the scope of the unallocated issues – the volumes of metals that apparently are now being removed (in cash) or put into allocated or PSLV are stunning. Additionally, stories of unallocated switched to allocated to be sourced from China is amazing. On top of this, you now have multiple mints/sources all playing the same game of months or year-long delays. These claims are indeed shocking, but in line with what many predicted about how unallocated will work. However, given there are single sources here – it is wise to also keep this in context until we get source verification.

3/23 – Adding the below 2 pictures The first one below is anecdotal, so we cannot use this as the “double blind” standard type of evidence, but if you see enough of these, you start to put the picture together.


3/24 – more anecdotal evidence creeping in about the Perth Mint and some good analysis pointing it to look like the unallocated is a fractional reserve of sorts. Recorded phone calls to Perth Mint appear to show they are slow walking the public? It is appearing that the rumors about those able to get unallocated into silver in their hands are true. Craig Hemke also wrote a post referring to this as well.
3/27 – Updates from John Adams say that 14 tonnes have been removed from unallocated from Perth. That comes out to be 450,100 oz (at 32,150 ozt per tonne?). So the question then is, are the vaults barren of silver bars, with the rest “in the pipeline” where users may want to then cash out and buy REAL silver somewhere else? 5/7 update – John Adams served notices by Kitco to cease and desist. Meaning, they feel John is not portraying their products accurately.


3/28 – Read several tweets yesterday stating that Rick Rule said that Canadian 1,000 oz bar is fully depleted. Can anyone help me source this interview? IF this is the case, I may have to make a change on a yellow to an orange. It’s a BIG DEAL for a nation to be 100% out of 1,000 oz bars. Tightness and high premiums, yes, but zero for sale? That can elevate things.
3/29 – now “Bullion Now” in Australia being added to the unallocated “bank run”. Seems that many people who thought they bought “banked silver” with unallocated are finding out it’s not actually there. This is a negative feedback loop I believe is in the early stages and may then have a potential of collapsing this derivative worldwide.

The below makes for great theater – but let’s define “stampede” – 5 people? 10? Does he have a source saying there are 300 voice mails staff need to answer about people wanting to cash out? “Stampede” is vague, BUT, for now, I’m willing to post this because I feel his company has credibility and can speak about these types of things. That being said, this is on a short leash of being here until I see some concrete data to back this up. I’m looking for media to report on this, if this is as great as it sounds, one of those souls getting flogged might be a member of the media OR have a family/friend who is a member of the media. OR….lawsuits being filed, which can then be referenced. I think John is at ground zero of this, but we also have to be careful about salacious words to describe something. “Stampede”. Is this 5% of all accounts? 90%? It’s possible he also has an inside source, which if he were to give details out, might also reveal the source.

Update 4/4/2021 – the pressure from John Adams is impressive, and we are now hearing complaints from the Kitco unallocated. There are also unallocated accounts out there that many don’t know about, and I personally have received a first person complaint about UBS unallocated (pooled) and gold. Essentially, they advertise low rates for unallocated – but then if you want your gold or silver, there are higher rates/fees they tack on and then want to smash you with crazy rates for allocated to discourage you from moving from unallocated. I feel THIS is the big shoe to drop this month. I believe as many are waking up, these unallocated accounts have been raided and others WILL take their cash out and go to PSLV and PHYS for silver and gold, respectively.
Update 4/7/2021 – Adding another item from John Adams, discussing a 1 year delay in the kitco unallocated account. It is becoming clearer to participants of these funds that unallocated is either a tiny pool of metal that has been exhausted or only a promissory note on future silver – at some point.

Complaints of defaults from ALLOCATED accounts (3/24) – I didn’t even add this to the metrics because I didn’t think this was even a thing. Apparently, it is. We now have ONE report from ABC Bullion in WSS – which is why it is not green, but yellow. If this has multiple reports from the same bullion bank, I’ll keep yellow. If this starts spreading to other bullion banks then I will move to orange. If I see this at 5, I will move to red.


Reports of 1,000 oz bar delays (3/22) – Chris Marcus had called up a bunch or dealers/wholesalers and was trying to see if he could place a $10m order, if he could get it the next day. Same with Andy calling around – and it seemed most were being told the earlier they could get them was March (this was mid Feb) at about a 4 week delay. Now, people can buy on the futures and get delivery by the end of the month, it seems. However, this delay should be felt at the industrial level by now, severely.
Higher than normal premiums (3/22) – over the last month, I have heard anywhere from $.75 to $1.40 from multiple sources. Recently, one of those sources had said they had heard it now down to $.30-$.40 for some. This is apparently unheard of for 1,000oz bars to have a $1.40 premium.
Higher than normal lease rates (3/22) – for those trying to borrow metal short term to then replace it, the leasing rates are elevated. A guest on Chris Marcus’ show (David Jensen) said that it was high, but not crazy high. I think it might need to go crazy high for some movement in this category.
3/24 – reports came in that GATA could not get any information on leasing activities from Bank of England.
COMEX inventory reductions
Update 5/18 – we have seen nearly 40m oz come off the COMEX in the last 3 months, and all expectations are now with industrial needs that this should be attacked in short order.

(4/18 – updated table to show 31m taken from COMEX since Feb) – I don’t put a TON of stock in this for price, but it is one of the metrics overall to keep an eye on. In the WSS post above, they made mention that the Shanghai silver exchange has had 400m oz of metal delivered this year??? I have to admit – the data here is hard to read, and says only 20m taken off the exchange. We have seen 26m from the COMEX taken off this past month. I had watched the registered not move a lot, but deliveries being made at times and spot moving up – suggesting they were sourcing from spot. David Morgan in a video I listened to yesterday called the COMEX registered the “showroom floor“. IF you start to see the showroom floor getting drained, it could be telling you something. That being said, he said he’s seen it before at 35m oz. I believe the danger zone here is this…..math.
As number of registered decreases, and OI either increases or stays the same, this increases the ratio of paper to silver, thus causing leverage issues. For example, if right now the OI is 800m oz and the COMEX is 125m in registered, this is a ratio of 6.4 paper contracts to each ounce for sale. However, if this gets to 900m oz and the registered gets to 75m oz, this is now 12x ratio and feel this stresses the system too much. So the ratio can double in no time with this, and this increased leveraged increases the risks of what happens if more people stand for delivery to take off. I have this at YELLOW because we have seen 26m come off the COMEX this past month, so it is noticed. Not danger zone. I feel that as the number of oz in the COMEX registered decreases, they need to drop OI to reduce stress levels with the ratios.

Supply chain issues noticed (4/18/22) – I am lumping a few things into this. Some of the stuff above shows how some mints are closing. Some of this is moving, some retooling for 2021 coins. However, it’s more inclusive to mints paying a higher premium to jump the line to get product. It’s talking about COVID delays. Perth Mint issues. Furthermore – I saw an article yesterday that said due to COVID, there’s shortages of a LOT of things showing up, causing higher prices (inflation). Maybe demand is much higher for a lot of things and there’s no one to make all of the demand? Furthermore, we are seeing tin issues as well as major auto makers now running into issues shutting down plants in North America due to chips not being produced (semi-conductor shortage). The “just in time” delivery mechanisms that work on global supply chains are breaking down. This leads to me to think that as important is silver is to electronics, that hundreds if not thousands of companies now have silver sourcing on their radar. Update 4/18 – Endevor withholding 500k oz, most mints appear to be closed or delayed with product. Coleman reports widespread premiums on wholesale.
5/18 – Bloomberg article and a lot of media attention now on supply shortages for EVERYTHING, not just silver.
Re-hypothecation being noticed and acted upon (3/27) – I believe as the world starts to wake up to what “unallocated” is, this may drain resources from institutions providing these, and this money may then go to a fund like PSLV. Currently, there could be hundreds of companies offering “unallocated” silver. Most felt it was based on a physical stack in their vaults, but with the Perth situation, many are now waking up that the unallocated situations MAY be a company selling the same silver many times over in a fractional reserve system. IF we hear of more issues with allocated/unallocated and the complaints become more broad, this CAN signal that these people who THOUGHT they were investing in silver then pull this cash out, then put it into a PSLV OR another company’s trustworthy allocated. THIS has a net result of significantly reducing derivatives of the metal and thus destroys derivatives and increases purchasing in the physical. IF it it’s true that there’s 500 paper claims in each ounce, this also could suggest that if those derivatives were then destroyed by removing what silver is there AND draining the cash equivalents, it can then go to trusted accounts that buy silver and this could be a nuke on top of a powder keg.
Price over $30 (3/22) – I feel to exit this phase, we need a price over $30. I also feel that if the 10yr had not risen as much, that we would have been there by now, perhaps at $35. The 10yr has depressed the paper price – but the physical buying has propped up the spot price. In a sense, all of the purchasing the apes have done over the past 7 weeks has held the price firm, despite significant pressures to push price down like it did for gold. That being said, IF we see a the 10yr recede OR DXY drop, we could get a boost with paper price, and quickly. I also feel that the bottoms are in with the metals and its getting harder for these algos to deny inflation and negative real rates – despite what CPI reports. The third time this goes for $30, I feel it will break through to perhaps $32 then use $30 as a base to continue higher. Not there yet. Green for the opposition.
Media attention levels (3/22) – as of now, green for the opposition. Supply chain stories ARE coming out. However, most are talking about food and semi-conductors, and no mentions of silver yet. When silver starts to show up in this conversation, it will go yellow. When panic stories start about global supply, this goes orange. When manufacturers shut down from no silver, red. Does not need to be red to exit this phase.
What needs to change with Industrial? What triggers can improve the status?
I feel the big thing right now is awareness of where this is – via media. There are supply chain stories, yes, but when we get a few directed at silver, and the impacts of this, I believe THAT is where we hit the jackpot. The WallStreetSilver DD mentioned above is tracking a LOT of different things right now – and this is more or less spoon feeding a story to a WSJ writer. I think when some of these billboards go up, along with local media coverage of that – coupled with supply chain issues and silver – the story could get big, quickly. I felt this would have happened by early march, but the 10yr delayed this by 4-6 weeks. While I did account for such things putting a monkey wrench in the timing – the 10yr going up is net positive for the movement because it sheds a light on inflation as well as force Yield Curve Control at some point. So short term it makes us upset, but this is a patience game. We won. They just don’t know it yet. As it is revealed to them we won, the media stories will come out.
Phase 4 – Short Covering
Current Status: ORANGE ALERT
With this phase, we will have to observe some of these things from a holistic level. Watching COMEX inventories is one way, but another will be in the media and price.
4/18 – upgraded, as it appears widespread shortages, COMEX down 31m oz in 6 weeks, widespread premiums on wholesalers and now with real rates dropping this is wind in the sails for gold. When gold was last at this real rate, it was $2100. We needed gold to kick in the door, and now silver will follow. This now tells me algos will start to shift to buy in the futures and anyone left short in this environment who haven’t already taken inventory out all mints and unallocated worldwide are in danger. Shortages should start to be reported inside of 60 days in the press, which will be when this trips to red.
Massive open interest (3/22) – With the short covering, there are 800m oz in futures contracts, but only 125m oz in registered. Now – it is shown that 400m of these are the “big 8”. However, they may be long physical silver in the registered, SLV (or the like), or perhaps even long futures in many cases. One big issue silver enthusiasts hate is that on any given day, you have 250m-500m oz “sold” in high frequency trading algorithms. The price is not “freely traded” based on supply/demand principles, but nudged, bumped, front ran – and topped off with trend chasing. While the supply demand fundamentals are clearly showing massive amounts of shortages (AT THIS PRICE), the robots somehow find it interesting to send price down $.90 before breakfast overnight. Makes perfect sense. These are the actions that many are trying to point out to the regulatory commissions. See, if there were fundamentals at play here – even if the DXY went way up or the bonds collapsed, you could at least make a technical argument for selling silver. This was not the case overnight. And this is the type of thing that buying physical silver will stop. Slowly, but surely.
3/28 down to 156k, but still very elevated. This is close to a year’s mine supply for sale, but the COMEX warehouses, in entirety, have 380m oz and none of this REALLY looks to be for sale. These massive contracts are used to push price down, so these owners of the 380m oz can then source from YOU to fulfill their obligations on sales.
5/18 – short is now over 900m oz. If this price breaks over $30 anytime soon, you will have a lot of broke banks about to happen.

That being said, at this time it’s in yellow status due to the massive risks involved with high open interest to diminishing registered supplies – on top of SLV telling people they may not have all of the silver. My conjecture is Goldman’s risk department acted on SLV saying all the silver might not be there and closed out 15m in open interest by withdrawing SLV stores and handing over. This negatively affects their ability to short, but reduces significant risk to be short paper contracts and to be long an SLV asset that might not actually be there – someday.
I have also demonstrated how I feel a bank run has already started. I believe banks understand the huge risk they have. Now, do they accept the risk and hand over what they have? Do they mitigate the risk by getting out of shorts? Part of me wonders if the commercials start to draw down open interest as they perhaps let the “dumb money” take that play, and they start going net long to trap the hedge funds? I believe something like this was recently reported in gold – but I don’t follow the gold COT closely.
Price spikes down on no fundamentals (3/27) – I added this one at 4:30 this morning when I saw the $.90 take down with no fundamentals changing. In my year observing this, it is indicative of entities trying to spoof to buy back their shorts cheaper to close or to perhaps knock price down a buck to then buy on the spot market and have YOU absorb that high premium they have to pay and STILL make a profit. In both cases, we see the V rise. Lastly – we have seen this at the end of months or quarters with profit taking for them to close the books. You can see this pattern happens near the end of every month, and the beginning of every month for the last 7 months (except this month) price has risen sharply. I’m going to be tracking overall open interest levels that were at 160k contracts on 3/19. Check out what this normally looks like – using a chart from a few weeks ago, so ignore my $8 move up suggested this month, the 10 yr shot that out the window.
Edit 3/27 – MASSIVE price spike down on Thursday 3/25 which may signify more swap dealers going net long. Price shot down $.80 and then rebounded within minutes back to $25.

I’m using this as a measure because to me, it is indicative of major commercials trying to get out of shorts or to cover them with metals purchasing and reduce OI.
3/24 – Check out yesterday’s spike, c/o Chris Marcus at Arcadia Economics


Open interest being reduced (3/23 0630) – as mentioned above, I’ll be tracking the 160k number to see if this gradually declines. Of interest, there could be a rise in OI if there’s a lot of buy orders driving price up, but if there’s a rash of buy orders, who the hell is promising to deliver? This is green and if I see this trending down, the colors will change. Overall, this might not mean a hill of beans, but I want to put this on the board for now. OI still at 160k (3/23)
Short interest being reduced by swap dealers (4/4 – updated table) – In the below chart, the suggestion is that as the blue is going up and the red is going down, this is the “swap” dealers reducing net short positions to “get on the right side” of the trade. With this, it could potentially mean that they are about to let the price run, but would NOT let it run until they had their positions in line.
5/18 – this actually reverse, and David Brady says it is bullish, but I’m not sure why. Seems they like to short into price rises, and I guess the idea is if enough of them pile on, it can drive price down – but not sure why it’s bullish.

Comment here – I heard someone saying about Michael Burry – how he was right. He had everything set up, but nothing was moving as it was supposed to. The thought was that it didn’t move until banks had gotten on the right side of the transaction. What this looks like above is just that – if the big banks are squared away that might be when this thing is “allowed” to run?
This chart by PJW (@timot78) sent to me suggests that as they are working to be net long, this can lead to price increases in the next phases.


PJW is far better at charts than I, and it seems to point out clear evidence price is about to run higher. How much higher? No one really knows, but given all of the retail action, ETF action, and supply of 1,000 oz bars, it suggests to me a near term $30 will be hit in short order to loosen up some supply – but I also feel this will awaken the sleeping giant of adding more retail sales and get more media attention. IF the swap dealers are behind the bus and not in front of the bus, this is then OK for them. Could be a SIGNFICANT price rise ahead.
Volatile price spikes higher and lower (3/22) for the better part of 10 days, we were in a trading range that was kind of boring. 10yr would go up, price dinged by $.25, then price recovers throughout the day. Rinse and repeat. If I’m seeing massive moves up, I’m thinking either lots of buying or short covering happening. If I see massive moves down, I’m thinking spoofing to buy shorts back cheaper or knocking down spot to then buy physical metals to cover contracts. If this volatility picks up, and we are seeing more rampant moves daily, it’s telling me they are trying to shake people so THEY are on the right side of this long.
Price over $35 (3/22) – this was the line in the sand I had where shorts were going to have to start throwing money at their OI to beg them out of positions. If they are shorting today at $25.50, I mean who the hell thinks that by end of May the price will be this low?? You are begging to be taken to the woodshed. This will turn yellow at $30, then orange at $32.50. Red at $35.
Media attention levels (3/22) – this will be media attention like was given to the Hunt Brothers. Not there yet. Nowhere in the same state, let alone zip code. I believe when you see one of these 8 banks either fail or ask for a bail out, we will turn this yellow. Two? Orange. When we see reports of people around the blocks at every coin shop, in every country of the world and no one can get it, we are at red alert. Until then, they are kind enough to subsidize out purchases at their own peril. So kind of those institutions to give me the stimulus of allowing me to buy $100 silver for only $25. Just so kind of them. I’ll be sure to thank them someday from my yacht.
What needs to change with Short covering? What triggers can improve the status?
This phase is activated due to the draining of the COMEX and perhaps the Shanghai exchanges with terribly high amounts of paper contracts trading daily – that could suddenly all want delivery. Remember, if indeed there are all of these mints shutting down and supply chain issues – and if this exchange is willing to source the product you cannot seem to get anywhere else, why wouldn’t industrial users drop the hammer? If there are 800m oz in open interest contracts at this second, what is to stop every single one of those people from wanting to take the product off of the shelves? Nothing. Right now, it is a calculated BET that only a fraction will take. Look around. No one can source for $26 yet you claim to have 800m at that price? Please. Allow me to take that off of your hands. Supply chain issues affecting many major companies right now? Please, let me take it from COMEX same-month delivery.
Update 4/18 – I feel the biggest things overall are two factors driving this bus – price and media, and both will feed off of each other. Real rates are at the center of this, and now that they are dropping, it appears instead of headwinds we can now face tailwinds.
About metrics – methodologies
In some cases with ticket systems, you can have 10,000 tickets and 9,500 completed within Service Level Agreement (SLA). That would give you a 95% measure. In other cases, you may use histograms to show things like count of customer complaints or count of positive comments over time. Maybe each month there have been between 5 and 7 complaints each month and this month is 47 complaints. What changed? It is possible that your process is broken, leading to more issues. It is ALSO possible that no one knew how to make a complaint, and now they know how to make a complaint, you now notice it. Please keep this in mind when I discuss all of the above, as each one of these items, for the most part, have been subjectively graded based on observed data. If I wanted to work for a PhD for the next 2 years at 14 hours a day, I would put together numbers for all of you on all of this going back 10 years, then I would look at Z scores, statistical process control, deviations from norm, etc – but we don’t have to go THAT deep to detect this. One could, but I don’t have the time nor inclination to do so. Suffice it to say, I understand what I’m talking about with metrics, but in this case have applied subjective measures in lieu of PhD-level data analysis that would yield the same approximate results.
The histograms, of sort that I am using (count of sites down, count of mints down, counts of oz drained) can also paint a picture when taken together. With the increasing amount of stories that are being collected and reported upon, this seems to be painting a picture of a histogram, so to speak, of negative comments, spread amongst many different areas. Meaning – my measures here are subjective, but paint a stark contrast to a situation with zero complaints or observing an ecosystem in normal functioning conditions. Meaning, if one dealer is running low on inventory, this is much different than every major retailer having shortages, delays, mint production issues, high premiums, and some having cancelled orders – in many countries. To objectively measure this would be mostly impossible unless you somehow went back in time and then measured every single retailer, tracked their available inventory, premiums, and delays going back x amount of weeks, months, and years to then measure how many standard deviations this was from the norm.
So – I am SUBJECTIVELY putting in colors for a lot of these measures because these are observable differences from the norms over the past year. While this is NOT scientific evidence, it’s mostly circumstantial (with direct evidence of reports) to paint an overall picture of the industry. This is MY OPINION of the markets, from how I’ve been seeing it, over the past year. It would be interesting for a David Morgan-type to perhaps have a dashboard of their own which might then compare this to 2011 and 1980 to see if the same types of measures were seen then, and what needed to happen in order to get that $50 move.
When I had written that I felt a bank run was going on – this is the type of stuff I’m seeing in my head and needed to put to paper to show you how I arrived at this conclusion. I felt GT at the top was right to call out a form of echo chamber where I was seeing what he was – the same few pictures being shared that had headlines that didn’t match up with the stories which became shark chum. It was time to systematically collect the evidence and try to objectively look at the whole while subjectively evaluating each piece of evidence.
What can you do?
- Think of other measures I have not thought of. How would you measure them?
- Rate what I put at different levels. Perhaps I put orange you would have put yellow or green. These are SUBJECTIVE measures and with this, it’s very similar to how you would rate an olympic figure skater. Subjective measures meeting certain technical and artistic criteria.
- Work with the DD on WallStreetSilver for the post I linked. Please help him track more issues and stories.
Media mentions, as I see them
FXstreet.com (3/22/2021) – Physical Silver Bullion Squeeze Could Lead to Large Gains
(removed zero hedge article as Reddit won’t let these post)
March 22, 2021 at 8:40 pm
Good evening as always, it is a pleasure to read you because of how easy and how well you sponsor the situation, I will only tell you that living in Spain on the border with France, I have not been able to buy silver for a month because of the premiums and delays in deliveries. I have been buying junior mining companies for a month. Would you recommend the PSLV, thank you very much.
March 22, 2021 at 8:58 pm
A great read Nathan.
Shared over at WSS via the Due Diligence flair
March 25, 2021 at 8:44 am
https://twitter.com/GerritAlexander/status/1372247770237702144?s=19
May 13, 2021 at 6:56 pm
Getting media attention on the fundamentals level.
https://www.cnbc.com/amp/2021/05/13/silver-price-rockets-as-investment-and-industrial-demand-continues.html?__twitter_impression=true