I don’t think it’s a surprise for me to tell anyone that there’s a high correlation between GDX and gold or SILJ and silver. But I often looked at these and wondered…
“SILJ is $16 today at $27 silver. I wonder what SILJ would be with $35 silver?” I know chartists may like to just do charts on these independent of the metals, but you might be losing valuable information in that – ratios that are trending may not be seen on a price chart.
I’ve done the same for GDX, etc. Why? I tend to play the gold and silver price with junior mining stocks, yes, but I also trade GDX and SILJ options on the price of gold and silver, respectively.
One thing I learned the hard way with this was when gold and silver dropped on June 18th, the miners got hit – but as metals prices held firm then and slightly recovered, the miners tanked. Like badly.
So it got me wondering about ratios and how I could figure this out? I could probably do a lot more with this, but I had 3 hours of sleep last night and most of the day off, and yeah, if I can’t finish my basement due to exhaustion, I’d love to play with charts and understand this more. So…buckle in.
Data
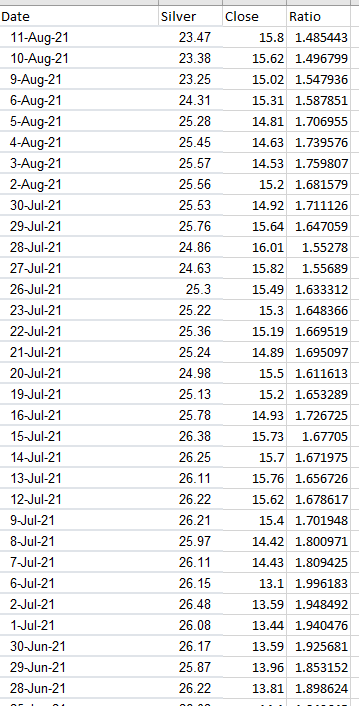
The first thing I did was go to Yahoo finance and download the data sets for the last year for gold, gdx, silver, and silj. You can see 10 years ago that GDX was much higher in value than today, so I’m trying to take a more recent approach.
You map the data, then divide one by the other to get the ratio.
This is what it looked like…

At this point nothing exciting.
Information
Information is taking data and making something from it. At Villanova, this was sort of the “Decision Sciences” classes I took under the MBA pre-reqs. I was an IT undergrad, so I had to take an ass load of classes over 4 years in 3 schools to get all the of the fun credits. I don’t want to get into minitab like stuff with x scores, z scores, confidence levels and all of that bullshit you PhDs like to ring me up on. I’d like to keep this somewhat straightforward so someone could do this same thing and get an idea of where I’m going with this.
With the gold and silver, I essentially wanted to understand most the average of the ratios over the last year. It might be true that miners lead the metals. In that case, some days the ratio will be lower as the miners outperform the metals up, and other days the ratios will be higher as the miners go down and perhaps lead metals down.
What did I find?


The items in blue I can plug in my info and it populates the dark grey cells.
Let’s look at this on pretty charts and take a peak…
First you have the silver to SILJ ratio

What do I see?
- The avg ratio is 1.71. The means on average, you can take the price of silver and divide by 1.71 to get the average price of SILJ. As I mentioned above, you may have outliers which lead the metals in a direction and I don’t feel like getting into a pissing contest with you on confidence levels and I’m 15 years out of using MiniTab.
- When you see these dots going in a downward trajectory, the ratio is lowering. Meaning SILJ is gaining ground on silver or silver is losing ground to SILJ. Meaning, SILJ is outperforming silver on the way down.
- Likewise, as the dots go up, you see silver rising faster than SILJ and outperforming it. This means silver is outperforming SILJ as these dots go up.
Key takeaway – the further away from the mean you go, the more likely for mean reversion. This suggests that probably in the next 3-4 months, silver will outperform SILJ as the trend will most likely start to move up. This ratio may go from 1.5 to 2.0 in that time. It won’t happen overnight.
Meaning, if I was expecting a ratio of 1.5 and silver was $24, that would mean I’d expect SILJ at $16. If this ratio held true, $30 silver might be $20 SILJ. However, if this ratio moves up to 2, it might mean $30 silver only gets $15 SILJ.
Using tools like this, and technical analysis – and your favorite YouTube pundits calling for “$40 silver by end of the year” you could then perhaps use an average ratio (1.71) or higher ratio (2) to estimate that SILJ could be between $20-$23.39. The higher the ratio, the lower on that price range you get.
Meaning, if I’m then looking at $17 call options for January 21 for $.85, that would suggest anything over $17.85 would be profit at that date.
Caveat. Silver might be the same price is now, then. Or, it could be $50 in October. Point was, if I had a guess at where silver would be, where could SILJ be?
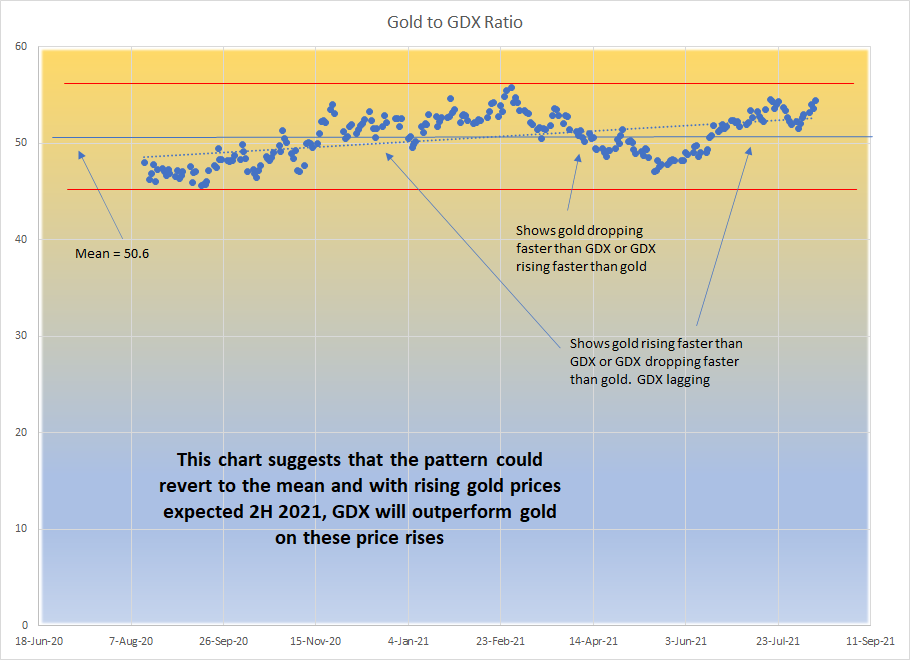
We now look at gold

In this case, the same type of structure is there. The spread is tighter because gold is not as spastic as it’s little brother silver who had a massive spread on ratio range. That being said, what this shows me is more or less the last 3 months, gold has been outperforming the GDX. It’s stretched out to its out range and suggests one of the two will occur:
- On higher gold price, GDX will outperform gold and have a higher price relative to gold
- On lower gold price, GDX will regress less.
This ratio is 50.6: 1 on average. For example, if gold now is $1775 and GDX is $33, you can visualize that for every $50 gold goes up, GDX goes up $1. I’m using ballpark.
When I am doing my options and looking at where gold might be in 3-6 months for options, I take something like this into account. This here shows very attractive buys for GDX in January, but I think my options for September aren’t going to turn the cruise liner around enough.
Let’s just have fun with this. Let’s assume we have $2000 gold at end of the year. Where is GDX?

The ratio right now is at 54.3 and in the last year, 55.74 has been the high. For 3-6 months out, I’d probably look the other way for a price target to be oscillating every 3-4 months or so in this band. If we have gold at $2000, I’d use the lower end of the ratio to then show a $43.82 price for GDX at end of December.
This is ballpark. Could the ratio stay elevated? Perhaps. Could the ratio continue lower as many institutions pour into GDX and we have a ratio of 40? Perhaps. At the peak of 2011 I see it at around $65 with $1923 gold. That’s a 29.6:1 ratio. Just last summer at $2075 gold, it was $42, or a 49.4:1 ratio.
Big picture?
If you see where this ratio CAN go when you have more institutional buying in, it’s quite possible to have a severe surprise DOWN on the ratio – i.e. your large ETFS could significantly outperform the underlying metal.
So – I’m going to be watching this ratio, and anything under 40 for gold to GDX and 1.2 on silver to SILJ could indicate the big boys are starting to enter, and that may be a REALLY good time to give blood and plasma to pile in before that gets overcrowded. This ratio might also suggest historically when this is crowded. The gold to GDX ratio at 29 was at the height of the frenzy in 2011. It had to be at peak participation. The underlying stocks in GDX could be somewhat different in makeup and percent of makeup of GDX – but these are just things I’ll be looking for as to when I might want to reduce my GDX/SILJ participation and maybe go to cash or buy more of the metal.
Hope you like!
1 Pingback