
None of this below is financial advice. Talk to your financial advisor. He will probably mock you for being in gold and silver miners.
It is pretty easy to buy stocks these days. Go to any trading platform, load up your fiat currency, and then BUY!! The more difficult challenge is when to sell. What many people do, is they buy some gold stock, it drops by half, they sell out of fear, and then curse the entire industry. That’s probably 90% of the people I encountered in this industry the last four years. Then, there are people I was begging to buy silver at $16 with no premiums, who scoffed at me – who then bought during silver squeeze at $30 with $15 premiums on Eagles, then yell at me. You have to have a thick skin in this sector.
But in respect to miners – these guys are how I plan to make money with PMs. The metals I buy, for the most part, are my INSURANCE against fiat collapse. Yesterday, I showed my step dad two silver dimes. He’s 75. I said, “in 1964, these two silver dimes bought a gallon of gas. Today, you take them to a coin shop, get fiat dollars, and they buy….a gallon of gas”. I then showed him a dollar with a “silver certificate” on the top of it, and put it next to one of my cull Morgan dollars. Told him that 70 years ago, these were of equal value. Now, I need 30 of those dollars to buy a Morgan at the coin shop. The idea is that I want to PRESERVE spending power – x amount of it – so if we DO have a super inflation or hyper inflation event, that the metals will PRESERVE my purchasing power for groceries and the like. Maybe I have enough PMs so that if metals go parabolic, I can pay off fixed debt mortgages? However – the issue you then have is taxes may go parabolic, so you pay off the note on the house, but cannot afford the taxes.
The idea of “getting rich” with a strong move in metals, to me, resonates in two forms: The leveraged futures casino and miners. I had done very well with futures this year, but the second you get cocky, you get slapped back into reality. I’m still up bigly this year on them, but at this moment, I’m worried about the cliff drop stuff in thin liquidity that really hurts. And, I don’t like putting stops on a lot of things because these freaking banks can see where all the stops are, and frequently raid the stops by selling hard into it, then buying back after the rinsed you all out.
What do I mean about getting “rich”? Well, part of what I’m looking for here is a 5-20x in my entire portfolio. 99% chance this doesn’t happen, but I’m sure many of you had those lottery fantasies as well. As a noob PM mining investor in April 2020, I put a massive wager down, and 3 months later I doubled it and sold off half. This was a “flash move”.
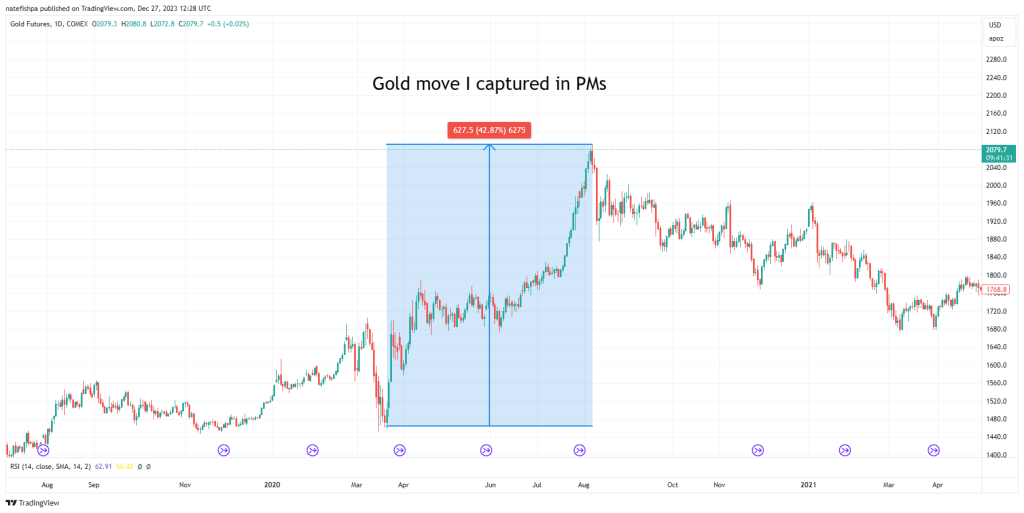
This was a 42% move up in gold. I didn’t hit the exact bottom, or top, but got pretty damn close. All of the senior metals analysts were screaming from the rafters about closing their positions or trimming them. I was scared of another March 2020 move, and with them, I sold off half. I had gotten a lot of 2xs, some 3xs, and maybe 1-2 4xs. Most of these were junior miners, but I had also dabbled with some call options on majors that went nuts.
Silver was almost a 3x from bottom to top.
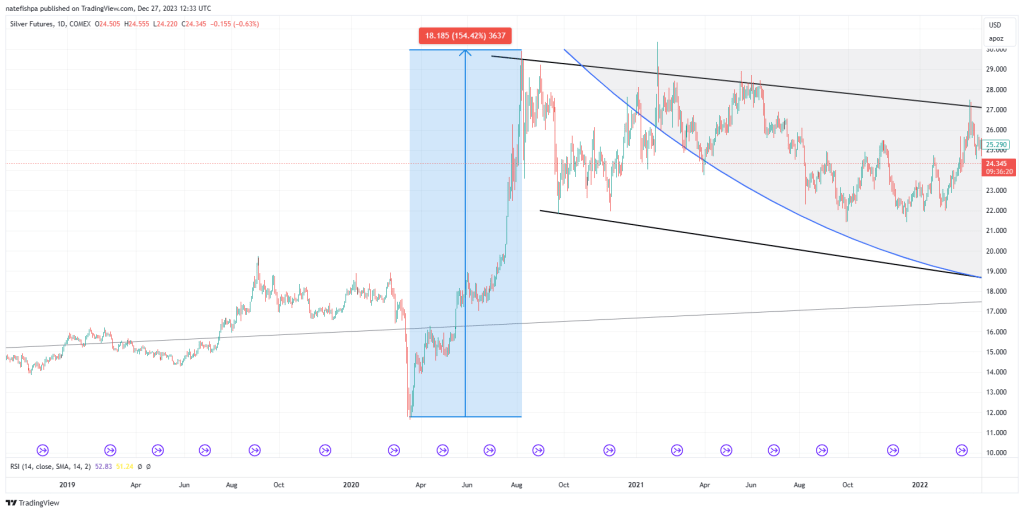
You could use vehicles like OneGold then, load up your account, and sell pretty soon after that for stellar gains. Now that I know how to do futures – at $11.75, I’m selling organs on the black market to buy contracts at $11.75. For each dollar move up, it’s a $5,000 pay day. So assume some people bought 2 contracts for $10,000 or so, they would have made $180,000 for the move up to $30. Thats an 18x on the move on silver.
But me – I was investing in the junior miners. Here’s one.
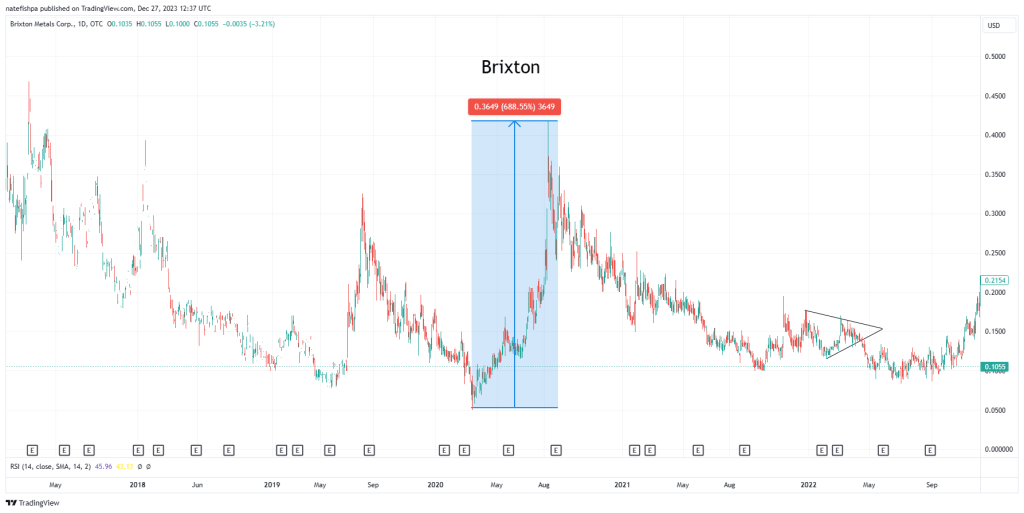
I didn’t capture the bottom here at $.055. I bought roughly around $.12 and sold somewhere around $.36. This was a Dave Kranzler pick. But let’s look at bit deeper at the chart at what the pros were seeing that I wasn’t. Only after doing this for years, and failing a lot, and learning a ton, do you sort of see a bit as to what these guys were thinking.

We first see the ridiculously low RSI of 30 and a red circle to BUY. Months leading up to this, was a lot of selling off. The sentiment was dreadful. Remember, “when people are fearful, be greedy?” Well, the bottom his March 2020, and everyone was scared. The pros were loading up, hand over fist, and noobs like me were just trying to mimic their moves, without a thought.
As things progressed to May, you can see a top happened where RSI was 70. This is where pros were taking “take some profits”. Maybe you had a $2000 position in Brixton you had bought at $.075, and at $.15, you had a double, and made $2000. The stock then retreats – but here’s the thing – in these bull moves, you start seeing strong buying around a 50 RSI. Price came down from $.15 to $.10 or so, and with the 50% pull back, in come the pros – buying more with the $2000 profit they had. So you now have $3000 loaded into the position. It then doubled again, about – from $.10 to $.20. Again – pros now sell half, profit $3000 and hold $3000.
RSI back down to 50, but price didn’t dip half, it only dipped 25%. Now, they load the hell up. The $3000 that remained was down to $2250, and they added the $3000 profit. They now have $5250 and are about to “ride the lightning” to a top. It then runs from about $.15 to $.41 or so, and RSI now 86. For many of them, they said “I’m out”. Because 86 RSI would need quite the cooling. This then left our pros with $14,350 from $2000 to start, or a 7.175x in a matter of 3 months.
But we aren’t QUITE done. We see RSI cool to 50, and people are now going back into the piggy bank. Pros are warning everyone – the move is over – but noobs run back in at $.24. It goes from $.24 to $.36 – but with this, it’s a 50% move. The GREED is then saying “I will get another 2x, I just need to hold”. But what happened next is – a higher low. And with that, the next thing that happened was a lower low.
Many of you came in at the tail end at $.24. I was luckily out around $.35-$.36. I never saw the $.41 area, but was very happy with my 3x as an amateur.
This was a flash – very similar to 2016.
What I’m being warned about, is that what is happening is closer to 2008 to 2011.
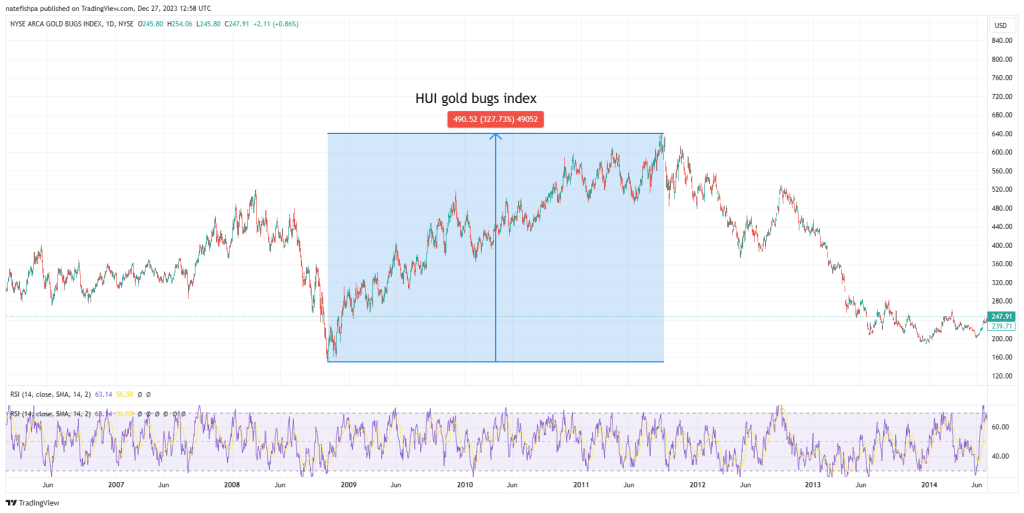
Here, I use the HUI gold bugs index. What you see with this is the MAJORS. You can see over a period of about THREE YEARS the move in the majors went up 327%, or about 4.25x. This is the MAJORS, not minors. These tend to go up a lot less than the minors.
What you see here is the saw tooth pattern. You also see what – HIGHER HIGHS, and HIGHER LOWS. With some exceptions.
Let’s look at the HUI from 2008 to 2011 to see what we can learn.
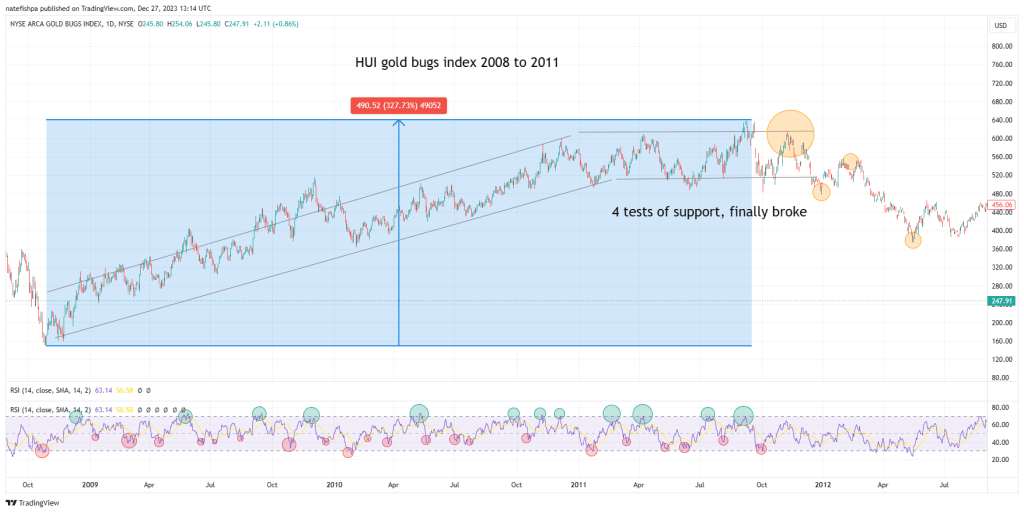
What you see here is a strong trend channel up. You can see most of the red circles are correlating with buys around the 40-45 RSI. You can see where the best selling opportunities appear to be the green circles which correspond with high peaks. During this channel up, you have:
- Most lows are RSI 40-45.
- For the most part, higher highs and higher lows
- Great opportunities to sell tranches at higher RSI, and buy at lower RSI
But the move STARTS to mature. Look how the trend channel started to flatten. This was 2011, where this then appeared to be “range bound”. What you see with this, instead of “higher highs”, you see “support lines bought”. The study here then shows that of the last 5 lows, 3 of them dipped to a 30 RSI, which meant sentiment was pretty bad. Eventually – there’s a form of buyer exhaustion as the end of 2011 hit – in the orange circle – you see a lower high which hits the support 4 times, and on the 5th, it broke down. There’s no magic number on how many times it takes, but the more times a level is tested, the greater the chance of break down. You eventually see – more people exiting the move than getting into the move.
What can we learn from 2011 to now?
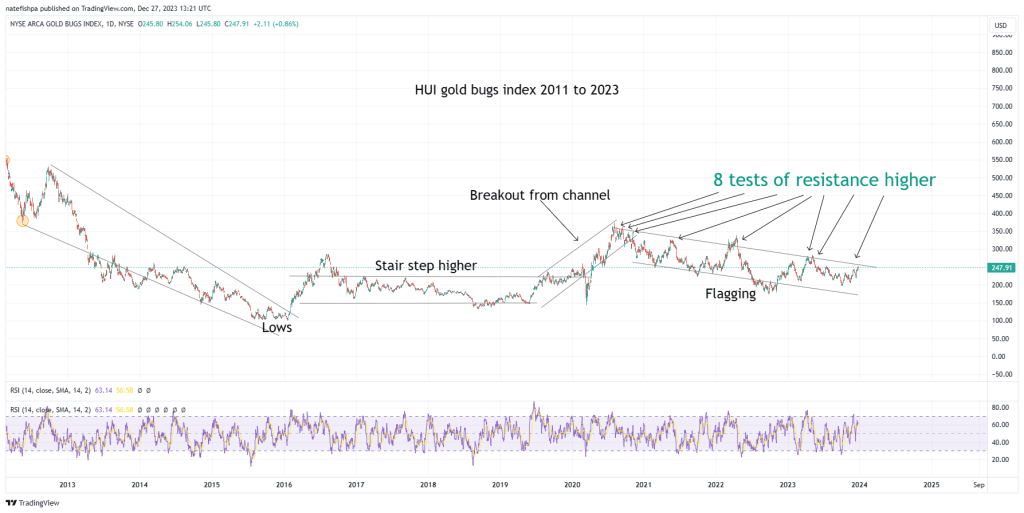
You can see a move down from 2011 to 2016. Flagging? Sentiment in the gutter? What it mainly SEEMS to be, was that profits from this were then rolled into things like the NASDAQ, which went up 16x from 2009 to 2021. It doubled in the period we see from 2012 to 2016, which indicates rolling from one asset class to another.
What then happens is a breakout up from the flag and it stair steps higher to a higher sideways trading channel. If you are a pro, you are making money on the up and down sides of these. But then the move after 2020 happens, and this is a breakout of THAT channel. The last 3 years appears to be a flagging channel. Bull flag maybe – will it simply explode up to a higher sideways trading channel? Or – can we perhaps envision building a giant cup here.
With the CUP formation, many are very hellbent on drawing these things for exact touches. And, in many cases, it works. And it is pretty. But you have to ZOOM OUT mentally, and see that it is a cruise liner turning around at sea. It may not be a perfect cup – but what it is, is sentiment for sectors/stocks changing, which takes a lot of time for people to become aware – and either sell out – or buy in.
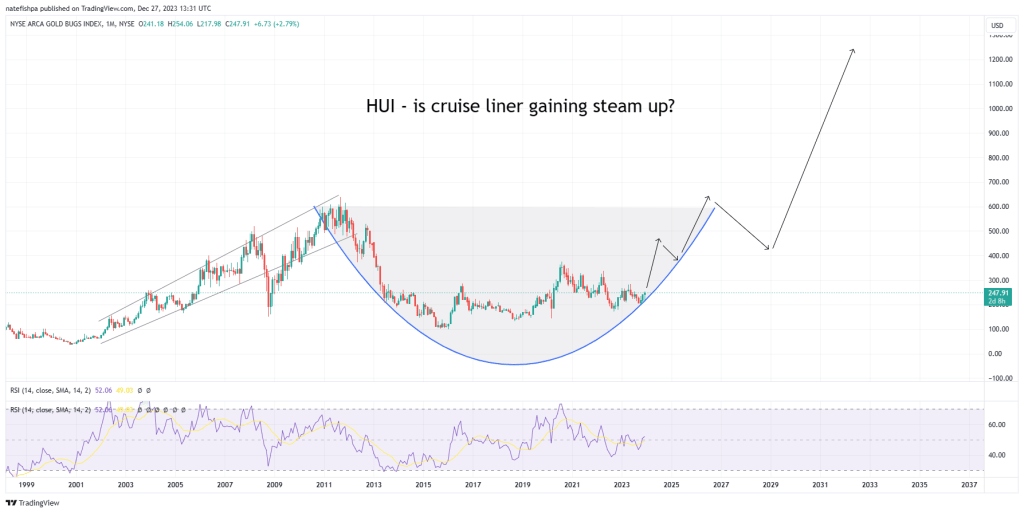
You can see the strong move from 2001 to 2011. While I only covered 2008 to 2011, it is reasonable here to see that this is a form of cup forming. Maybe it won’t, and break down. But let’s recap from the 50,000 ft view. We are at a point where the pivot is about to happen – and we all know that gold tends to explode during this period of time, anticipating more inflation and debt. It therefore is VERY reasonable to have a thesis here that things are about to explode up in the sector. But – like 2008 to 2011, this isn’t vertical. Maybe it is a shorter move like from 2020, but when it comes down, it then “touches” the wall and explodes higher for a move?
So – we have dealt with a lot of pain the last 3 years. The question then is – how to you deal with the move(s) up? Do you sell out of everything?
My recommendation here is to listen to a lot of the “old timers”. Any of these analysts that were around from the 2001 to 2011 moves up, have great perspective on timing, patience, buying tranches, trimming positions, and taking your chips and going home. Since it makes sense to hold PMs as insurance against fiat failure – why not get rich on the PM stocks?
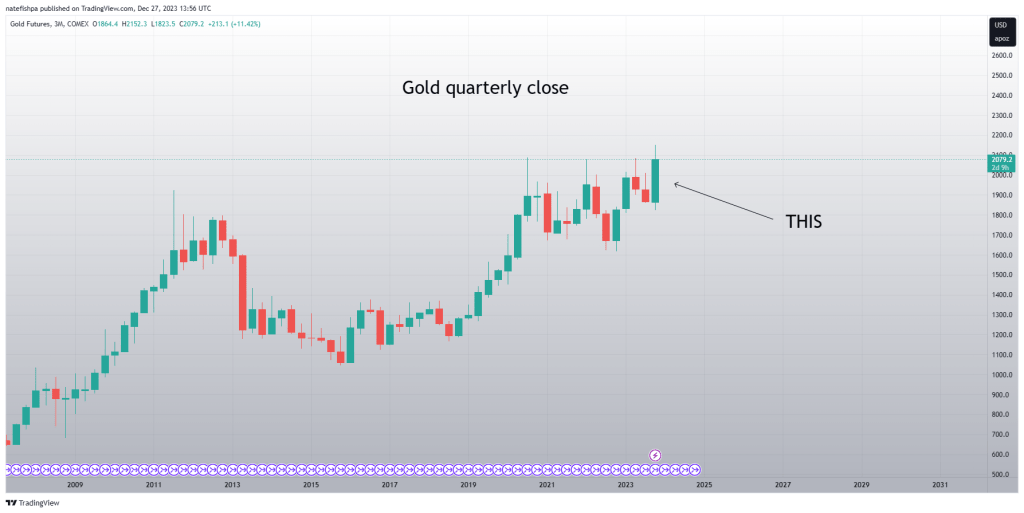
The last chart there was monthly for the HUI. But are we dreaming?
Gold is about to have the highest monthly close – ever.
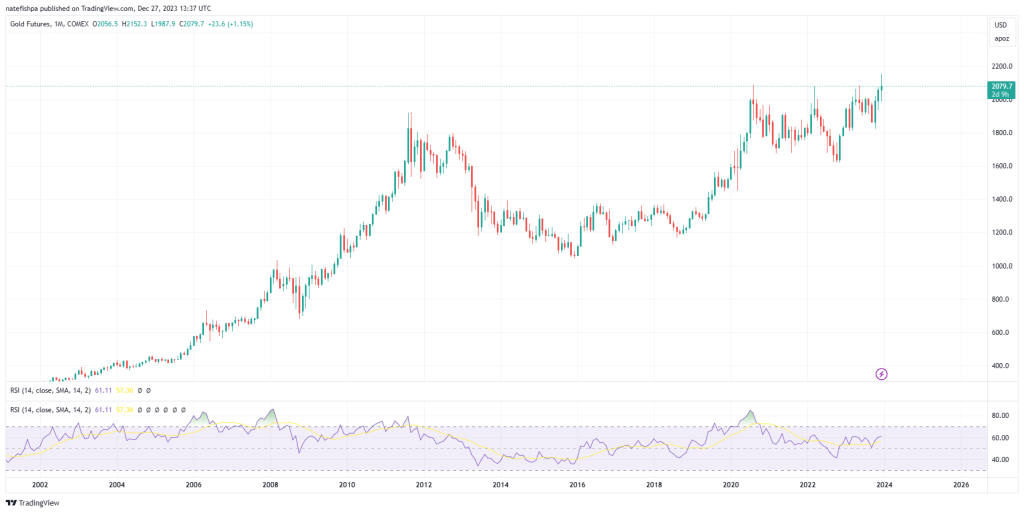
And – with this, you can start to kind of paint an up channel here in your mind.
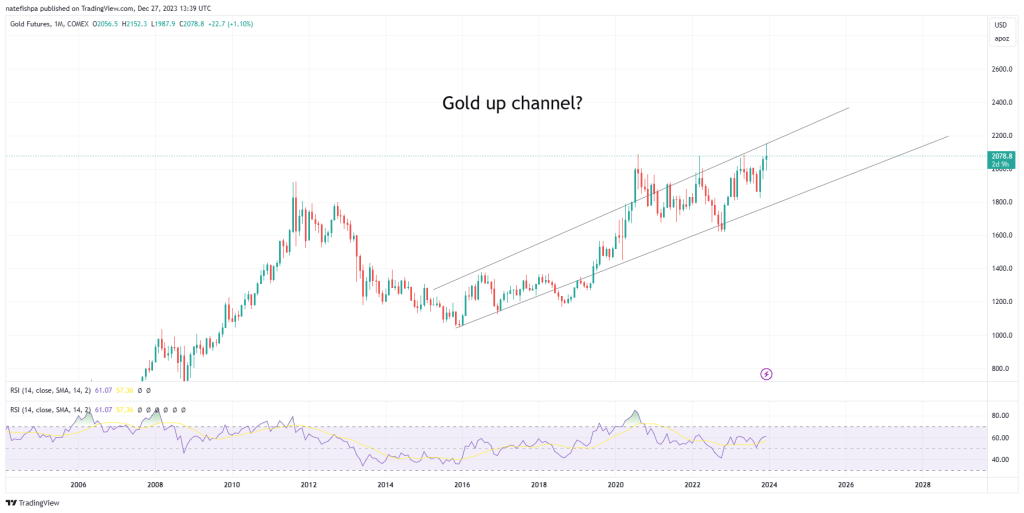
How many times can we test the resistance on the top of the channel before it explodes up?
For those cup and handle people – we also have some fun.
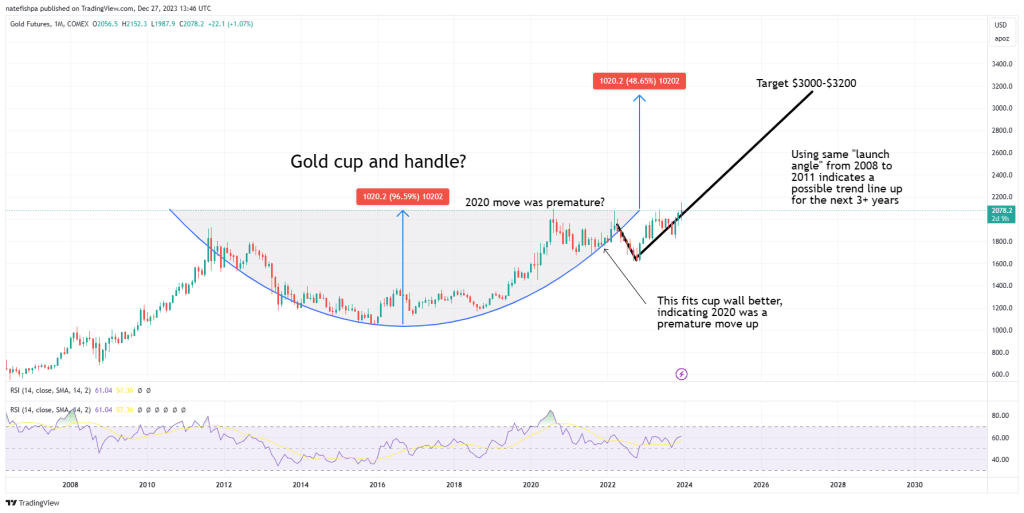
My targets may not be in line with how the cup and handle is strictly done, but my feeling here is we will be running a lot more hot than not. IF we are in a 3-4 year move, and IF we use the same types of move angle from 2008-2011, we can see we are knocking on $3000. That would have this gold move from 2015 from $1000 to $3000.
Question for you. If a junior gold miner is making $250 per ounce profit on 500,000 oz mined per year, today, what is that profit? $125 million? Now, imagine the price of gold goes from $2000 to $3000 in that time? The profit goes from $125 million to perhaps $625 million? If they had a 15x P/E ratio before, what does that do to their market cap then? A micro junior with perhaps $100 profit goes to $1100 profit per ounce.
Conclusion
I’m starting to hear a lot of analysts who have been around a very long time start to get giddy. Even one guy who talks about “one more pullback” all the time – says he’s all in on the next pull back. But I ask you – if your conviction is THAT strong, why not go all in now? Maybe a 10% down move in gold is then met with a 75% up move? Or, you sit on the sidelines while the move happens?
While no doubt that we see that gold will have its many pull backs – one cannot help but wonder if – THIS IS THE TIME.
What do you think? Do you think that you are out when you break even, or do you see what some of these analysts are talking about? In my Arcadia video released 3 months ago – I discuss how when the fed pivots, it’s good times for gold. And…good times are here again.

The caveat here – is all of that was being done in a decreasing fed funds rate environment. We could anticipate lower rates ahead, and with it, more currency creation and pain for the debasement of fiat currency. But if we do have “higher” for longer” and rates keep rising over the next 5-10 years, how does that work? Well, rates in the 1970s exploded, and with that, gold went up 24x and silver 29x.
No one can tell you how this is going to end – but you need to start thinking about how you want to play this over the next 3-48 months. Are you out the second you go green? Are you playing dips and peaks like a pro may have played Brixton? Or, are you just holding the HUI/GDX for a few years and hope to make a 3x?
I’m hunting big, big, big game. You need to find what is right for you.

Leave a comment