I loved physics in college. Too bad I didn’t get an A in it, as partying was more important than having a functioning brain at 8:30 AM Tuesdays and Thursdays with Dr. Khanna. In physics – we’d learn about A, then learn about B, then our tests were about C – trying to combine A and B with never doing it before. While I hated the tests, the subject matter I would listen to would enthrall me. My professor would also testify in court cases regarding traffic accidents – you know, a 5,000 pound car claiming to go 35mph tries to stop and skids for how many feet? You need to know the coefficient of friction for those tires, on that surface, and reverse engineering this can potentially tell you the car was going approximately 70 and not 35.
What you learn in physics is about a LOT of different types of things like that. It’s all around you. One thing I took from that was the coefficient of friction. It’s particularly important when living in the northeast part of the United States, where winters can be brutal with snow, ice, and sleet. You then start seeing the gradient of the hill, wondering how good the tread on your tires is, and then wondering about the surface to see if you may have conditions for an accident or not.
Michael Gayed has talked about some ratios – one in particular was interest – the lumber to gold ratio. I believe he says (don’t quote me) – that when this ratio crashes, that it then sets a CONDITION where an accident may be more likely, similar to it getting dark out and raining. It doesn’t mean the car will have an accident, but the CONDITIONS are there. On a post at one point I half jested that perhaps some other indicators could improve the model – for instance, if you ALSO have a copper to lumber crash WITH the lumber to gold crash, perhaps it is now snowing a foot of snow and you have bald tires on a windy mountain road in -10 degree weather.
My point was that a single indicator, back tested, could be a strong indicator of something to come. After all, they say history doesn’t repeat, but it does rhyme. If you unpack what that ratio is, and use it in a macro sense, it could be that rates went up, housing is crashing, and the demand for lumber drops off the face of the earth. As that is happening, gold either increases, stays the same, or drops at a lower rate than the lumber drop. Meaning, you are seeing a mathematical function of what I showed in a graph a few days ago – when rates rise, as the pause happens, gold starts moving strong.

So a ratio going from 10:1 to 2:1 could be showing the problem. The MACRO event is rates rise, houses get more expensive on a monthly basis UNTIL the supply/demand fundamentals are satisfied – and EITHER rates OR asset prices (or both) start coming down. But, they typically do NOT come down without things starting to break.
In this case, the lumber to gold ratio is a NUMERICAL means of seeing what EVENTS may be going on.
Many then want to use PRICE charts as another SINGLE INDICATOR of price to come. My problem with this is that it is highly unreliable. I love to do charts with TA, because they help me visualize what COULD BE. But many do not realize that all of the patterns you see have a poor reliability for success to indicate future events. For example, one of the FIRST trades I ever did was out of the COVID bottom, a buddy of mine told me to watch Mastech.
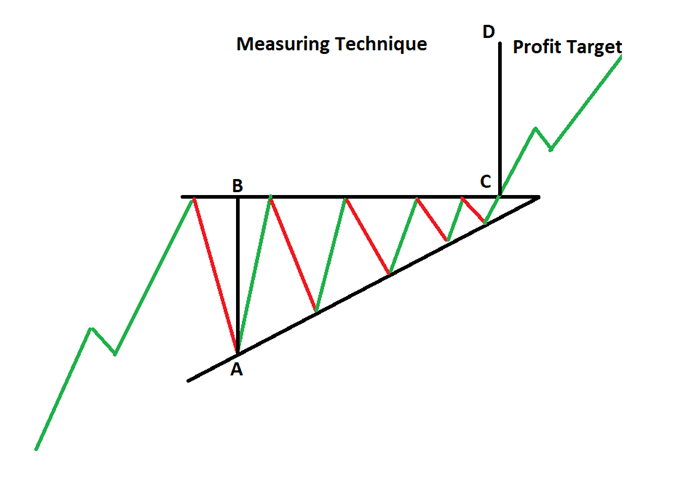
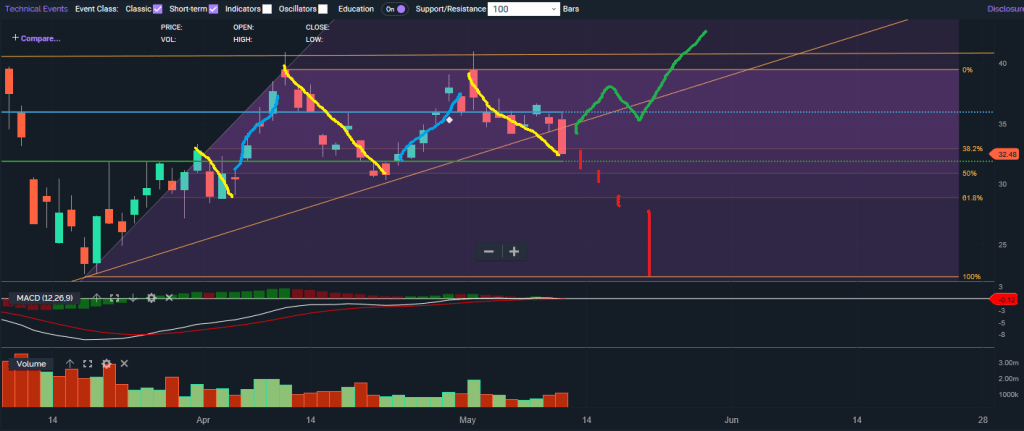

Now, the black chart covers until the end of May, and the white chart shows that May was still VERY early in the triangle. Eventually, it went parabolic and rose $72 over the peak of the triangle. I had calls on this and made out well, but was out of the trade before the monster move. TA could have helped me a little here holding that trade longer, BUT the problem is – we had just had a massive cliff drop and FEAR was at play. Money was on the sidelines. The MACRO event here that pushed this, and everything else up was the Fed and treasury “printing” $6T to put into the economy.
Basically, EVERYTHING had a “reflation trade”. At the same time this was going on, my entire portfolio doubled in size in 4 months due to my gold junior miners.
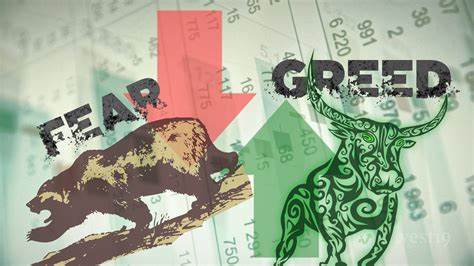
A TA would look at the chart (AFTER THE EVENT) and say it is an ascending triangle and this was supposed to happen. But many miss that this pattern may only have a 60-70% success rate, at best. TA makes attempts to help you understand the FEAR AND GREED. This makes a lot of sense – to a certain degree.
I had seen a quote recently by someone famous – I wish I would have taken a screenshot – it said something like, “a crash is a market that didn’t properly factor in likelihood of a risk”. Many of you like to think “the markets priced that in”. But what happens when the herd is wrong? Do they all eat like pigs at the trough, or do they all get led to the slaughterhouse?
One of the reasons for this post was that a few times Gareth Soloway has NAILED bitcoin crashes, almost to the exact dollar. Was he a prophet sent back from the future? No – he used fib levels and charts to predict where this could go based on FEAR and GREED. Now, the last I saw, he was off on a recent call with this, but twice I saw him nail this. Does this mean now that TA is sent from the gods? Does it now mean it is a 100% predictive tool? No.
But why so accurate on bitcoin and not other things? To me, suddenly I started thinking about how some things could be more sensitive to fear and greed than others. Why does oil go up? Well, you can read the headlines and see that OPEC is calling for production cuts. This can then send the price higher on FEAR of supply issues which then have people FRONT RUNNING (greed) an eventual market equilibrium. However, UNTIL that macro event happened, you could have a chart that was compressing and looking like it was going to go down. You then start to realize that in the ABSENCE of macro events, the MIND uses FEAR and GREED to buy and sell. Like I just said, in the ABSENCE of macro events.
So then you have to understand the complexity of a given market. Nat gas seems very sensitive on stored supplies. A whisper of supplies being down 20% could make the price go vertical. We used to see this in economics with specific markets – price elasticity.
What is price elasticity?

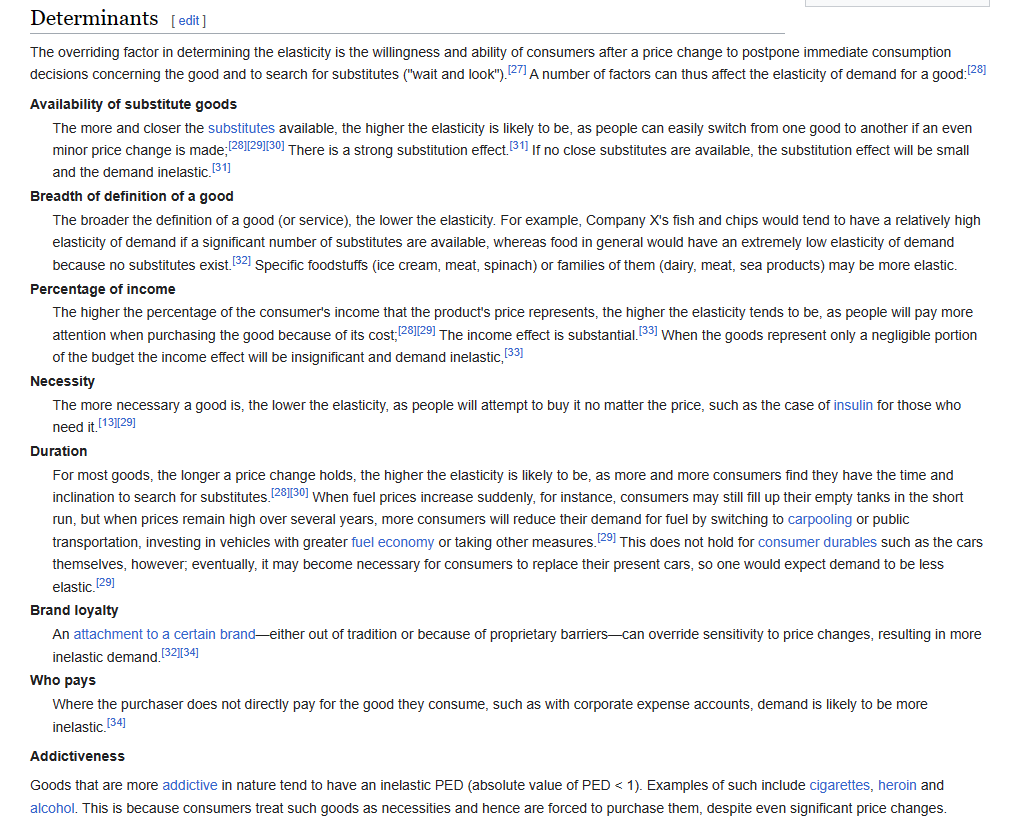
How important is that market to society? For example, a sudden supply shock to gasoline might make the price go vertical upward, but perhaps a shortage in a brand ofchewing gum wouldn’t really be a big deal as people may just substitute another brand.
What this tells you is important.
- The TYPE of market it is can show you the volatility of the market.
- The TYPE of market can tell you how sensitive it is to macros
- The TYPE of market can tell you how FAR a price can go based on how long it may take for supply/demand equillibrium to catch up.
Meaning – let’s assume two markets for comparison:
- Market A (Bitcoin) – is high in demand by a small subset of people on the planet. At this time, there is no practical use for the product. While the advocates for it are fervent investors, they are PROJECTING a usage which may never happen year down the road. This is a HIGHLY SPECULATIVE market which may be more sensitive to fear and greed, and thus may be much more accurate on TA charts.
- Market B (silver) – is in high demand by manufacturing as it is the world’s best conductor of electricity and is used in over 1,000 products. Additionally, it was used as money throughout history, so there is a strong correlation with the gold market. It is currently in high demand based on the need for solar panels. While there is a great deal of supply above ground, the cost to mine this is now approximately the same as the current market value – which is determined by a facsimile of supply/demand in that the pricing of it is determined by a derivative paper-supply market. While at times, fear and greed can push this in certain directions, there are many dozens of determinants that will drive the price longer term. Therefore, short term TA is extremely inaccurate for this market. Longer term TA MAY have some success IF they factor in how price discovery works – by essentially having banks create crashes or short squeezes on the COMEX paper markets.
So how can you chart the one with the same rules as the other?
You cannot. Yet TAs do this all the time. Every time I do a writing like this knocking TA, I have to tell people that I love it. I have to tell people about my friends Patrick Karim and Kevin Wadsworth – and how they do a great job showing PROBABILITY and not CERTAINTY. I have gotten into it with a few TAs on Twitter only when I see arrogance in CERTAINTY because of some moving average nonsense. As Gayed would state, “just because it’s raining doesn’t mean there will be an accident, but it provides the conditions for it”. He is also speaking in terms of probability.
Then we have David Brady – who I am a HUGE fan of, and 25 years ago coming out of college in another life I would have loved to have worked with him on this FIPEST model he has. To me – this is perhaps the closest model I have seen to how to “guess” where things are going. Why? Because it does use TA, and Elliot Wave, but it also deals with sentiment, fundamentals, and a bunch of other things. Many of the trolls online like to pick on Brady. He has a knack of saying “one last pullback” a lot – which to me also has him speaking in probability. Many like to say, “he was wrong about X and deleted tweets”.
I think anyone with a brain in their head with trading sees all of this in a perspective of probability. Brady and all of the other crews out there guessing aren’t going to be right 100% of the time. But they also manage risks on trade better than you, and have a means of playing probabilities a lot.
One of my close HS friends, M – worked for a hedge fund until recently and is now trading for himself. By trade, he was a meteorologist and dealt with probability with models. He dealt a lot with trading energy and soybeans – but his first love was horse racing. We did fantasy football in HS before the internet – and he used to do horse race betting after school (he was 18 before all of us). The betting helped pay his way through college, and eventually after he made a small fortune at a hedge fund, he started buying horses for racing. I had seen some articles where he had at one point 95 horses. We just caught up a few weeks ago after years of back and forth texting – but his story is a story of success through probability and confidence in certainty.
I bring it up because if TA was so accurate, every one of them would be worth many millions, many times over. I think the best of them provide good subscription services and this can be a tool in your investment arsenal. They continue to improve their craft, back test, and change models. If you are a Brady and are using TA as ONE INDICATOR, it then also makes sense that you have many other indicators.
So what about a coefficient of fear?
You can clearly see that gold reacts to FEAR. War, bank crisis, inflation. But what we also see is that unless this is a sustained event with constant fear, the trade subsides. Silver may follow this and move further – but when the immediate fear subsides, so does the profit in the trade. Gold may have a BLACK SWAN fear coefficient of .95. However, a 3-6 month window, where paper trades and jewelry demand take over, the fear coefficient may be .3 where market dynamics are more the driving force.
If you look at gold, long term, take a look at the Bollinger bands
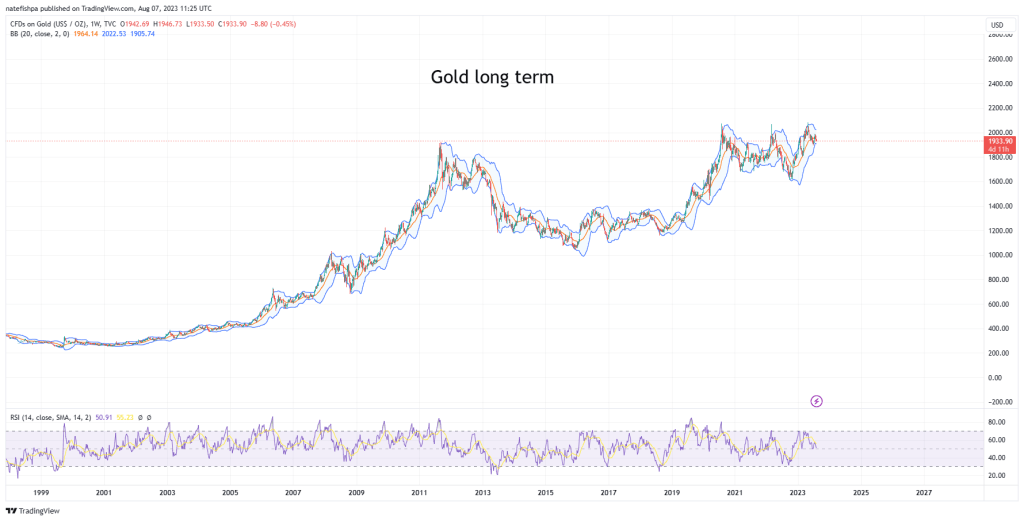
This to me sort of shows the channel in which this trades, and with this, you can sort of see a confidence level of past performance with this. This is on a weekly, but lets look more closely on a short term daily with the Ukraine War black swan.
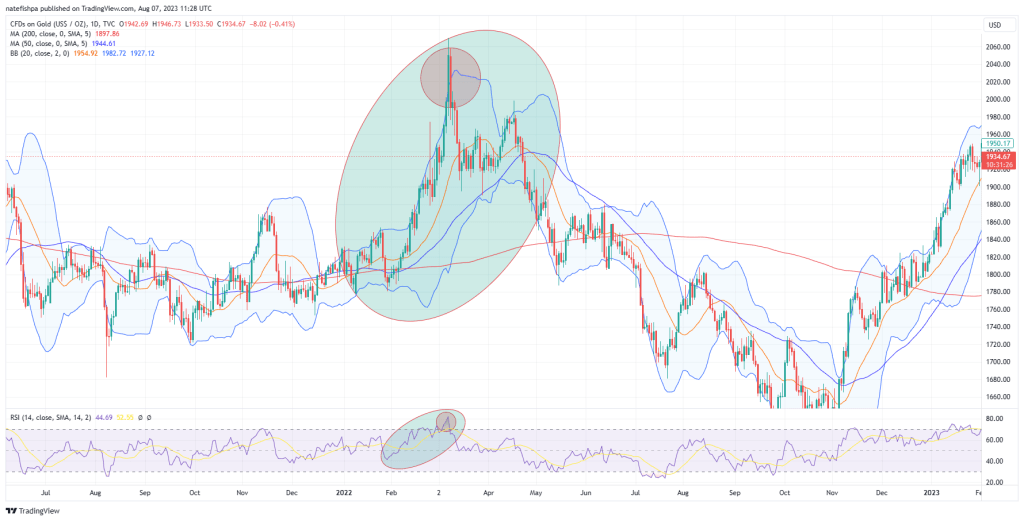
You can see that all the way up, it was trading at the top of the bollinger band. You can see RSI at the bottom going way high. You can see how high over the skis are from the 50dma and the 200dma.
Then….down she went. And with this, it would trade at the bottom of the bollinger band. If you look at this bigger picture, it’s a channel of likelihood stretching the probability of a move.
What I would then think is that when you deal with items with different coefficients of fear, there would be a band around the destination and time. The higher the coefficient is to fear, the tighter the band. The lower the coefficient, the bigger the band. What would this look like?
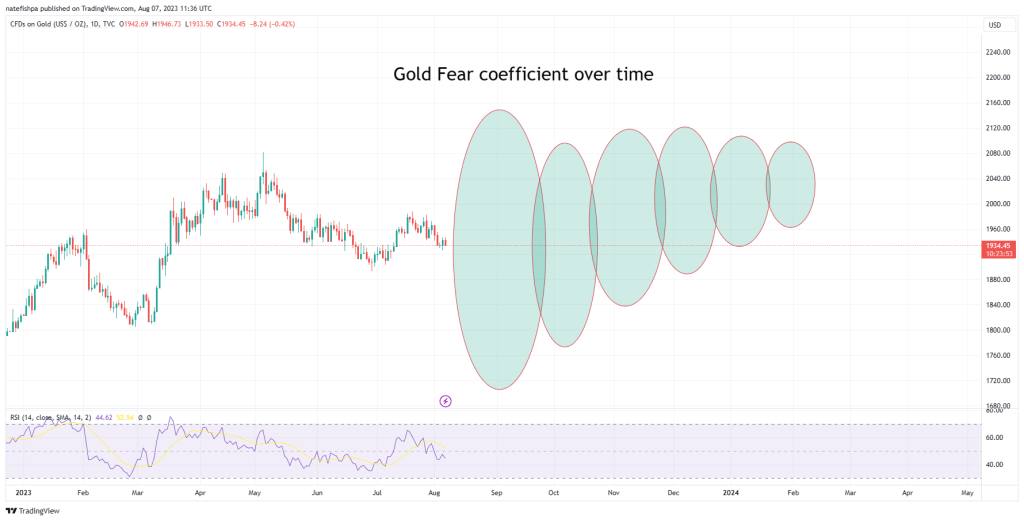
As time would go on, the band would get smaller. Meaning, a SHOCK one way or the other could move gold LOTS today, but in the long run, the band would be more aligned with supply/demand fundamentals.
Likewise, bitcoin doesn’t have supply/demand fundamentals of substance, and with this, may have a consistent .95.
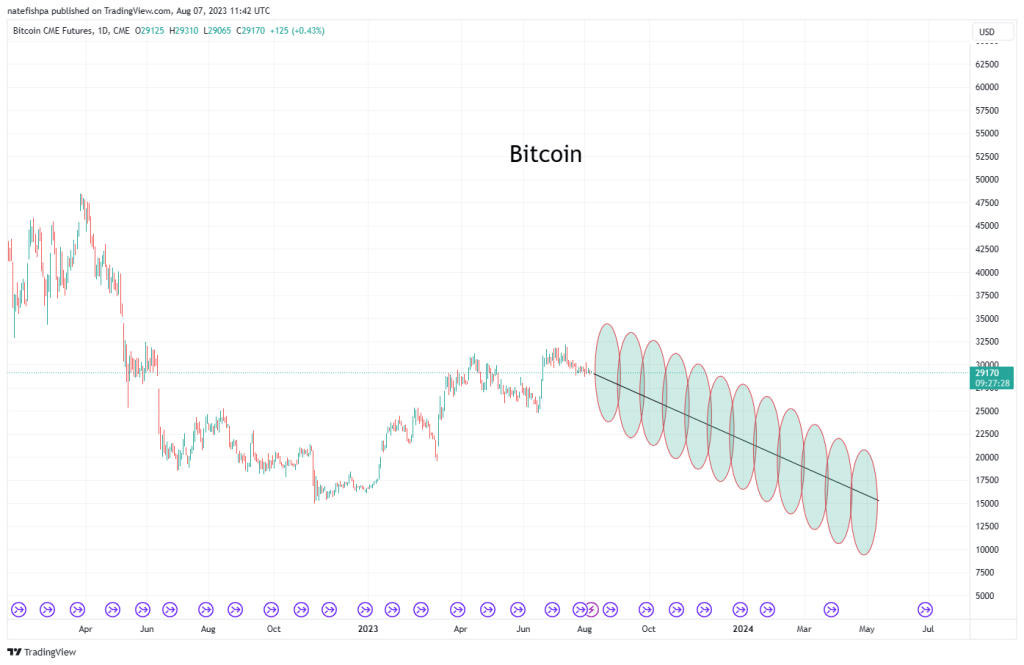
In this case, BTC may have a TA determined path to get to $15,000 by May 2024. No idea. But these bands can provide a relative coefficient of how to get there. Since it is all behaviorally driven, the destination is known, but the black swan ratio isn’t as high as gold.
With probability, you need to understand how 60% success works. If each trade you have $2 stop for losses and $2 stop for win, you have $4 after 10 tries. Now, was $10 put up or $1000?
You also have to understand that with 40% success, you can still make money if you manage stops correctly. Imagine you had a $1 down stop and a $2 up stop. That is -$6 in losses, but $8 in wins. You are still up $2.
The problem is, many of you try and find someone who is right ALL the time. You want to find that person with 100% success, so you can invest all of your money i9nto one pull of the slot machine to then retire. It doesn’t work like that. I’m sorry, it just doesn’t. Big money people have things that don’t go their way all the time, but they just manage risk better than us plebes.
So if you look at a Brady, or a Soloway, or anyone – they might vary in degrees of right by 55% to 65% “right”. Maybe someone has a good year and is at 70%. Even at
Conclusion
No one can PREDICT the future, or future prices. Those who have the most robust tool sets probably have an advantage as they are not relying ONLY on price action. Those who rely on single indicators like price, likely need to manage risk extremely actively in order to not lose their shirts on any one trade. One may consider that those who use tools in addition to price action – like fundamentals or ratios – could have better “win” percentages.
However, what many need to understand, and hopefully I demonstrated here – it doesn’t matter about “right or wrong” at 65% unless you manage risk appropriately. Us in retail are the worst at it, because we get emotionally invested. Our ego makes us think we will be “right”. We are ok with holding on “for one more day” to see if it turns around.
Overall, however, I wanted to point out that it seems to me some markets are more sensitive to TA than others. And with that, a correlation of sorts to TA could be devised with a regression analysis to then provide a coefficient of fear and greed for different time intervals. This coefficient could thus be a “golden goose” of trading houses if they could determine the confidence in TA, and relate that in a weighted formula to other factors. It could also provide a statistical understanding of movement based on this – for example – what is the most gold is “allowed” to move in a day – 4%? We have seen some really volatile days, but that is NOTHING compared to crypto or nat gas. So while gold may have a short term fear and greed coefficient that is higher than most, the total distance it can move is x.
All of this can be solved by the MIT guys – but the truth is, I don’t think any of them are looking at this.

Leave a comment